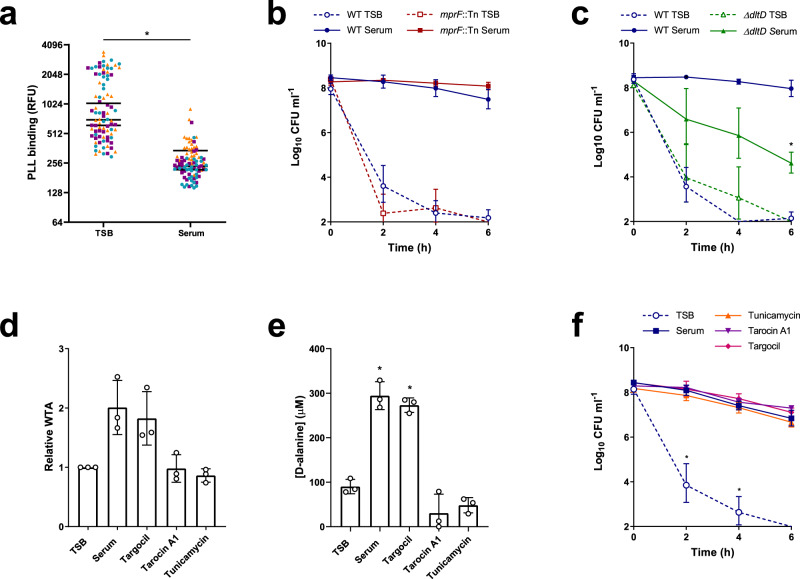
Fig. 4. GraRS-mediated changes in surface charge do not explain serum-induced tolerance.
FITC-PLL binding to TSB-grown and serum-adapted cultures S. aureus JE2 WT. Cultures were incubated with 80 μg ml−1 FITC-PLL, washed, fixed and analysed by fluorescence microscopy (a). The fluorescence of 30 cells per biological replicate (90 cells total per condition) was measured and the mean of each replicate is indicated. Colours represent different biological replicates. Log10 CFU ml−1 of TSB-grown and serum-adapted cultures of S. aureus JE2 WT and the mprF::Tn mutant (b) and the ΔdltD mutant (c) during a 6 h exposure to 80 μg ml−1 daptomycin in serum (b). WTA extracts from TSB-grown bacteria and cultures incubated in serum supplemented, or not, with 128 μg ml−1 targocil, 64 μg ml−1, tarocin A1, or 128 μg ml−1 tunicamycin for 16 h were analysed by native PAGE with alcian blue staining and quantified using ImageJ (d). Concentrations of D-alanine in WTA extracts from panel (d) were determined spectrophotometrically using an enzyme-based assay and by interpolating values from a standard curve generated from known D-alanine concentrations (e). Log10 CFU ml−1 over 6 h exposure to 80 μg ml−1 daptomycin of TSB-grown S. aureus or cultures which had been incubated in serum supplemented, or not, with 128 μg ml−1 targocil, 64 μg ml−1 tarocin A1 or 128 μg ml−1 tunicamycin for 16 h (f). Data in (a) were analysed by a Mann–Whitney test (*P < 0.0001). Data in (b) and (c) represent the geometric mean ± geometric standard deviation of three independent experiments and were analysed by two-way ANOVA with Sidak’s post-hoc test (* for (c), P = 0.0036 serum-adapted WT vs serum-adapted mutant at 6 h time-point). Data in (d) and (e) represent the mean ± standard deviation of three independent experiments and were analysed by one-way ANOVA with Dunnett’s post-hoc test (*P < 0.0001 (serum), <0.0001 (Targocil) vs TSB-grown). Data in (f) were analysed by two-way ANOVA with Dunnett’s post-hoc test (*P = 0.0222 (2 h), 0.0072 (4 h), serum alone vs TSB or serum + WTA synthesis inhibitor). Several points fell below the limit of detection of 100 CFU ml−1. TSB, tryptic soy broth; FITC-PLL, fluorescein isothiocyanate-poly-L-lysine; RFU, relative fluorescence units; CFU, colony-forming units; WTA, wall teichoic acid. Source data are provided as a Source Data file.

