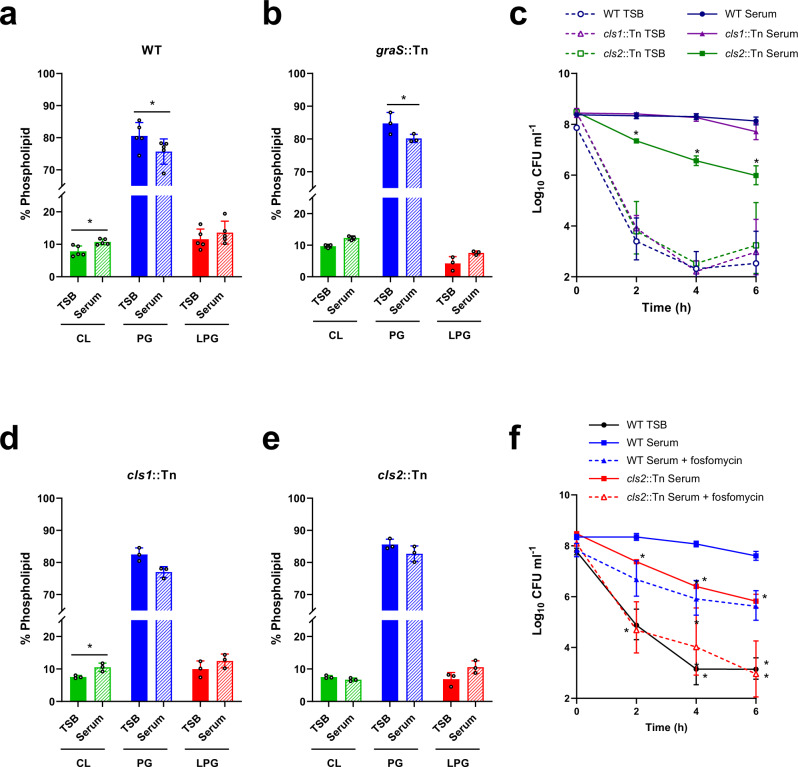
Fig. 7. GraRS-independent changes to the staphylococcal membrane also contribute to tolerance.
Phospholipids were extracted from TSB-grown and serum-adapted cultures of S. aureus JE2 WT (a), the graS::Tn mutant (b), the cls1::Tn mutant (d) and the cls2::Tn mutant (e) before being analysed by thin layer chromatography and visualised with copper sulphate and phosphoric acid. The relative phospholipid compositions were determined by quantifying spot intensities using ImageJ. Log10 CFU ml−1 of TSB-grown and serum-adapted cultures of S. aureus JE2 WT and the cls1::Tn and cls2::Tn mutant strains during a 6 h exposure to 80 μg ml−1 daptomycin in serum (c). Log10 CFU ml−1 of TSB-grown and serum-adapted cultures of S. aureus JE2 WT and the cls2::Tn mutant strains during a 6 h exposure to 80 μg ml−1 daptomycin in serum (f). Where appropriate, adaptation was carried out with sub-lethal concentrations of fosfomycin (dashed lines). Data in (a), (b), (d) and (e) represent the mean ± standard deviation of at least three independent experiments and were analysed by paired t-tests (* for (a), P = 0.0015 (CL), 0.0116 (PG), 0.1002 (LPG). For (b) P = 0.2642 (CL), 0.0222 (PG), 0.1069 (LPG). For (d), P = 0.0491 (CL); TSB-grown vs serum-adapted for each phospholipid). Data in (c) and (f) represent the geometric mean ± geometric standard deviation of three independent replicates and were analysed by two-way ANOVA with Dunnetts’s post-hoc test * for (c), P = 0.0008 (2 h), 0.001 (4 h) and 0.0066 (6 h) serum-adapted WT vs serum-adapted mutant. For (f), P = 0.0163 (2 h WT TSB), 0.0115 (4 h WT TSB), 0.0018 (6 h WT TSB), 0.0022 (cls2::Tn Serum 2 h), 0.0002 (cls2::Tn Serum 4 h), 0.0034 (cls2::Tn Serum 6 h), 0.0349 (cls2::Tn Serum + fosfomycin 6 h). CL, cardiolipin; PG, phosphatidylglycerol; LPG, lysyl-phosphatidylglycerol; TSB, tryptic soy broth; CFU, colony-forming units. Source data are provided as a Source Data file.

