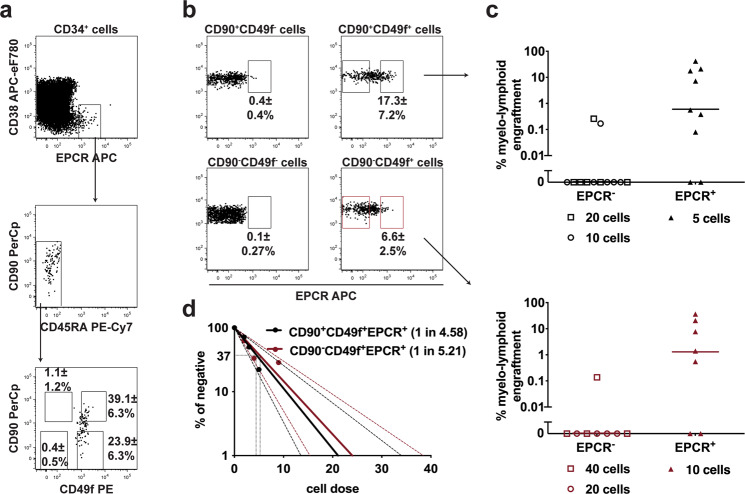
Fig. 3. In vivo studies support EPCR as a marker for the repopulating cells within both CD90+CD49f+ and CD90-CD49f+ populations.
a Representative phenotypic analysis of EPCR+ cells in cord blood CD34+ cells. Frequencies were calculated based on the gates shown (n = 8 mice) Of note, three different commercial anti-EPCR antibodies gave very similar staining profiles (Supplementary Fig. 2c). b Frequency of EPCR+ cells within CD90+CD49f+, CD90−CD49f+, CD90+CD49f− and CD90−CD49f− populations respectively (n = 8 mice). c Engraftment of EPCR+ and EPCR− cells within CD90+CD49f+ and CD90−CD49f+ populations (flow-sorted as shown in (b)) assayed in NSG mice 12 wks post-transplant with the denoted cell dose. Results were from three independent experiments (n = 7–12 mice); median lines are shown. d SRC frequency within (CD34+CD38−CD45RA−) CD90+CD49f+EPCR+ and CD90−CD49f+EPCR+ populations; 95% confidence interval is shown. ± shown is the S.D for the no. of experiments performed. The anti-CD201 clone RCR-227 was used in all these experiments. Source data are provided as a Source Data file.

