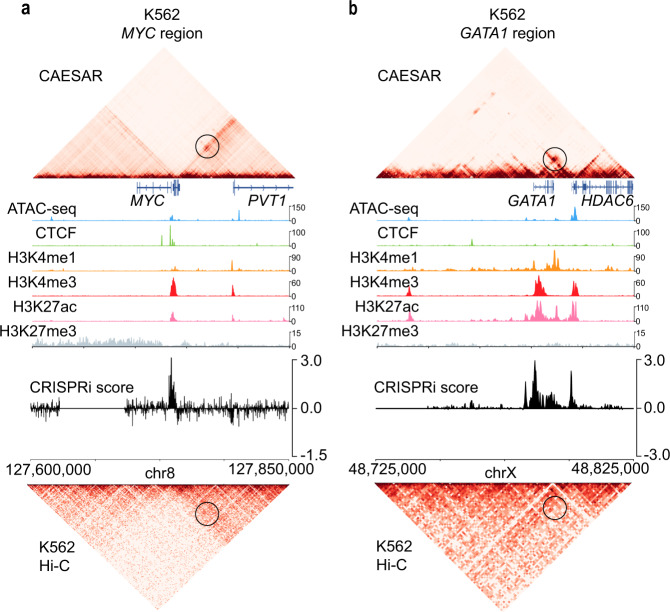
Fig. 4. The interactions between genes and their CRISPRi-validated enhancers in CAESAR-imputed contact maps.
a The CAESAR-imputed contact map of K562 at MYC region (chr8: 127,600,000–127,850,000) demonstrates significant contacts between MYC and PVT1, which agree with CRISPRi score peaks, but are not shown on the original input Hi-C contact map. The magnitude of the epigenomic features is the observed value divided by the genome-wide average. b The CAESAR-imputed contact map of K562 at GATA1 region (chrX: 48,725,000–48,825,000) demonstrates significant contacts between GATA1 and HDAC6, which agree with CRISPRi score peaks, but are not shown on the original input Hi-C contact map.

