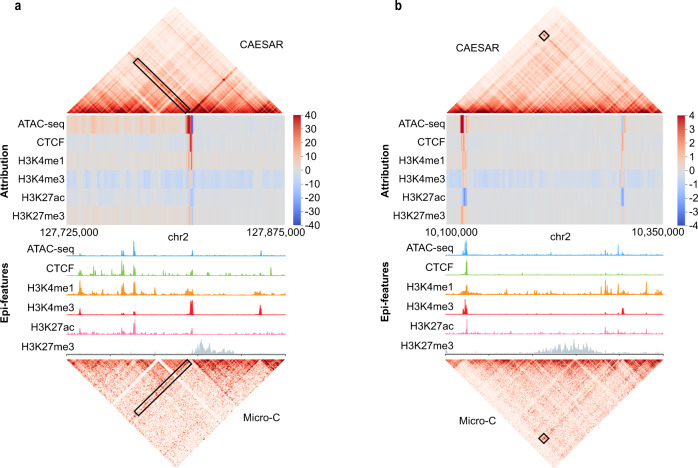
Fig. 6. Attributing CAESAR outputs to epigenomic features via integrated gradient.
Larger attribution magnitudes indicate more contribution to the model’s prediction. a The significant attribution of the particular stripe are from its anchor. Although all six epigenomic features have peaks at the anchor locus, the model predicts the stripe mostly from (1) ATAC-seq and CTCF peaks at the anchor, and (2) H3K4me1 modification surrounding the anchor. b The significant attribution of the particular loop are from its two anchors. Although H3K27ac have peaks at the left anchor locus, its contribution is negative towards predicting the loop. The CTCF binding at the anchors and H3K4me1/H3K4me3 modifications next to the anchors have positive attribution in predicting the loop.

