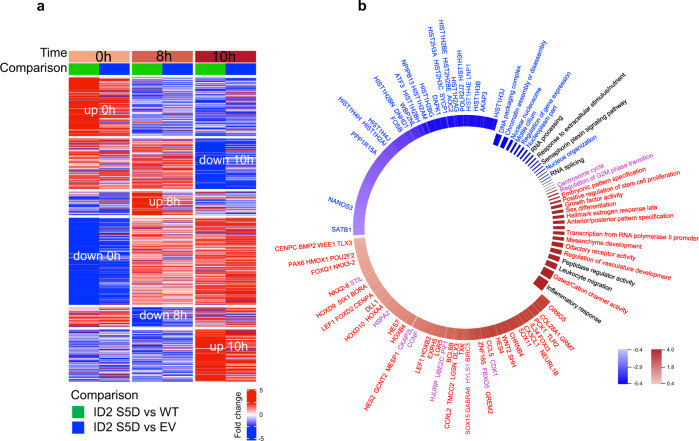
Fig. 5. The transcription profile of ID2 S5D expressing cells denotes the inability to establish the G1 phase of the cell cycle.
a Heatmap representing differentially expressed genes of triplicate biological samples comparing cells overexpressing ID2-S5D with ID2 wild type (green track) or with the empty vector (blue track) synchronized by double thymidine block (0), early M phase (8 h), and early G1 (10 h). b Circos plot showing genes and pathways perturbed in cells expressing ID2 S5 phospho-mimetic mutant compared with ID2 wild type expressing cells. Cells were synchronized by double thymidine block, released in normal medium and collected 10 h later (M-G1 transition). Differential gene expression was evaluated using MWW-GST (two-sided). Genes and pathways downregulated and upregulated are in blue and red, respectively. The experiment was performed using three independent biological replicates.

