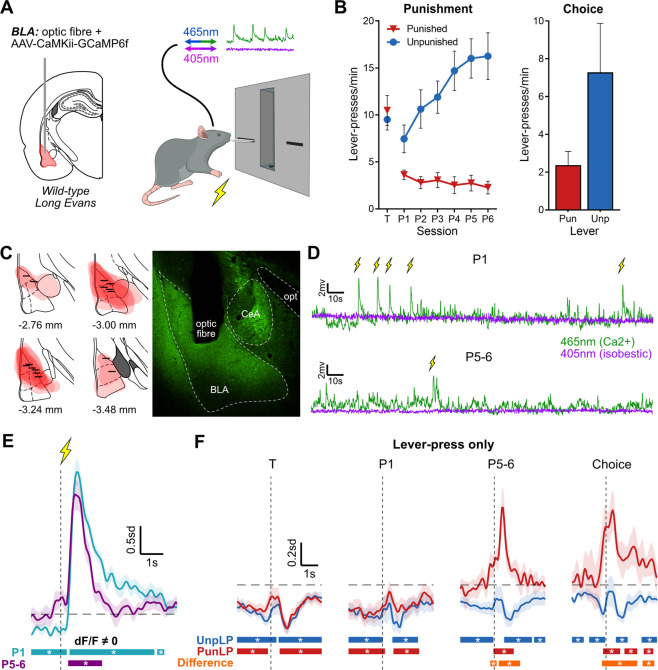
Fig. 2. Basolateral amygdala activity during punishment.
A Fiber photometry to assess basolateral amygdala (BLA) activity. Left: Rats received unilateral optic fiber implant and application of AAV-CaMKii-GCaMP6f into BLA. Right: BLA neuron activity was measured throughout punishment. B Behavior of BLA photometry animals. Left: Mean ± SEM lever-press rate on punished and unpunished levers for last day of lever-press training (T) and punishment sessions (P1–P6) (n = 14). Right: Mean ± SEM lever-press rate during choice test (n = 10). C Left: GCaMP6f expression and fiber tip location for animals included in analysis (n = 14). Right: Example BLA placement. D Example of 465nm- and 405nm-related signals during early (P1; top) and late (P5-6; bottom) punishment sessions, with shock deliveries times. E Mean ± SEM of subject-based (n = 14) BLA activity kernel around shock deliveries during early (P1; teal) and late (P5-6; purple) punishment. Bars at bottom of graph indicate significant deviations from baseline (dF/F ≠ 0), determined via bootstrapped confidence intervals (95% CI). Vertical dashed line indicates shock onset, horizontal dashed line indicates baseline (dF/F = 0). F Mean ± SEM BLA activity kernel around punished (PunLP; red) and unpunished (UnpLP; blue) lever-presses (no outcome) across training (T), punishment (P1, P5-6) and choice test. Bars at bottom of graph indicate significant deviations from baseline (95% CI) for PunLP and UnpLP, and significant differences between punished and unpunished kernels (Difference; orange). Vertical dashed lines indicate time of lever-press, horizontal dashed lines indicate baseline (dF/F = 0).

