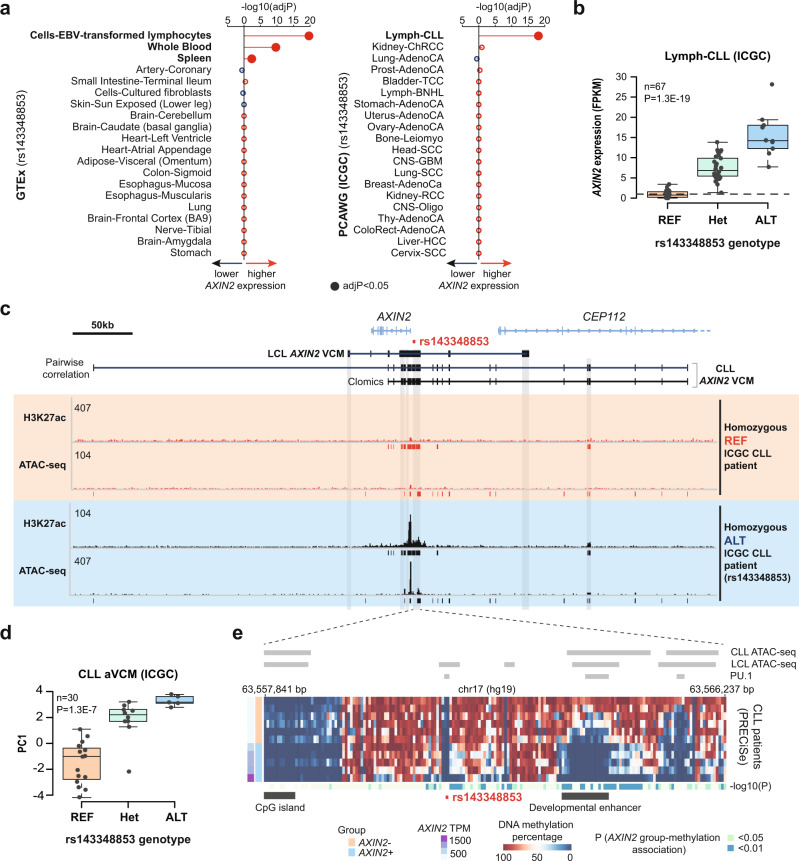
Fig. 2. The AXIN2-rs143348853 eQTL is highly cell-type-specific.
a AXIN2-rs143348853 eQTL analysis on 49 GTEx tissues (left panel) (only the top 20 tissues based on the nominal p-value are shown) and on 20 cancer types from the PCAWG project (right panel) (cancer abbreviations as provided in the original study26). The GTEx nominal p-values and effect size (normalized effect size, NES) were obtained from the GTEx portal. The PCAWG p-values and effect size were obtained from a linear regression model. Significant hits (Bonferroni adjusted p-value (adjP) < 0.05) are denoted in bold. b AXIN2 expression from CLL patient lymphocytes from the PCAWG project according to the rs143348853 genotype. c Genomic view of the AXIN2 locus showing the CLL VCM structure based on the two different calling methods) and H3K27ac and ATAC-seq signal profiles from two different CLL cell populations, representing the rs143348853 homozygous REF and ALT genotypes. Meta peaks are displayed below each track. The considered LCL and CLL enhancers, based on high H3K27ac signal, are marked with gray boxes. d aVCM measured by the first principal component analysis value (PC1) on all correlated molecular phenotypes (H3K27ac and ATAC-seq) embedded in the CLL AXIN2 VCM, as called using the pairwise correlation method. e DNA methylation on the indel-enhancer from several CLL cells based on WGBS. Cells are grouped based on AXIN2 mRNA expression (AXIN2 + and −, which corresponds to high and low AXIN2 expression, respectively). AXIN2 expression in transcripts per million (TPM). CLL and LCL ATAC-seq and LCL PU.1 peaks are displayed. CpG island coordinates were obtained from the UCSC Genome Browser. The region found to be in the top 5000 most hypomethylated regions in later stages of B cell development compared to NBCs29 (i.e., developmental enhancer) is also denoted. n and P indicate the number of considered patients and nominal p-value from a linear regression model, respectively. For b and d, boxes indicate the IQR (25–75%) and the box center indicates the median. Whiskers represent de minimum or maximum values of no further than 1.5 times the IQR for both the top and bottom of the box.

