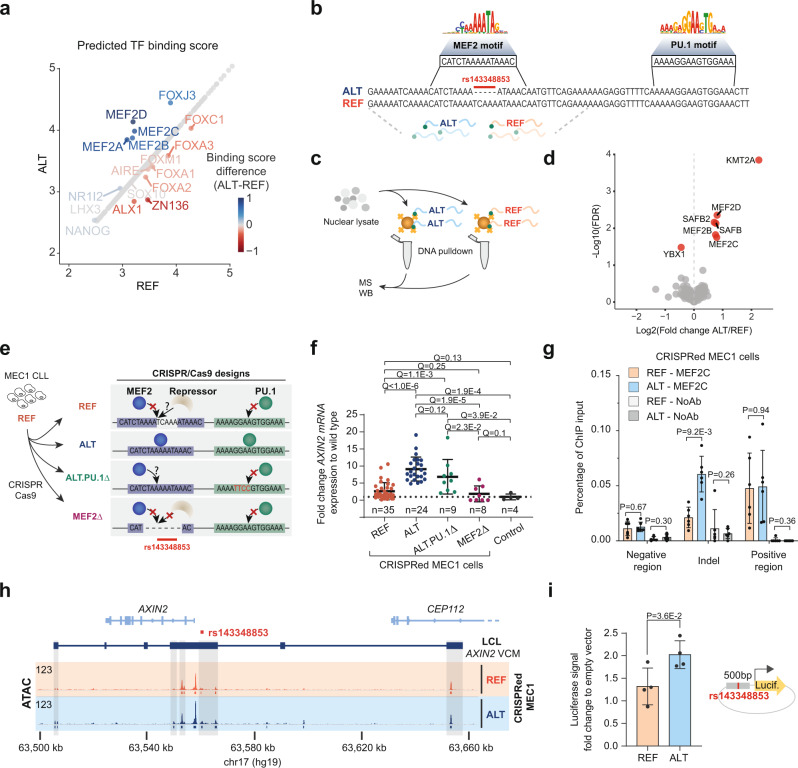
Fig. 4. De novo MEF2 TF-binding site formation by rs143348853.
a Maximum TF-binding site Z-scores for both rs143348853 alleles across 757 bp around the indel. b DNA sequence representation of the indel region according to the NCBI dbSNP23 build 154 of the two alleles, with a represented logo of MEF2(A) and PU.1-binding motifs based on ENCODE GM12878 data from Factorbook112. Underneath, the DNA sequences used for the pulldown experiment are highlighted. c Cartoon illustrating the in vitro DNA pulldown experiment with the DNA oligos (see b) from the two different alleles, followed by mass spectrometry (MS) or western blotting (WB). d Bound TFs to ALT or REF DNA probes detected by in vitro DNA pulldown followed by MS for three replicates. Significant TFs are colored in red and labelled (FDR < 0.05). Only TFs42 are shown. e Schematic of the CRISPR/Cas9 experiment to modify MEC1 CLL cells to validate the effect of rs143348853 on AXIN2 expression (ALT and REF) and to test two additional scenarios: ALT.PU.1Δ and MEF2Δ. Control cells are clones that received the plasmid but did not undergo homologous recombination (2 clones for each ALT and REF construct). f Each value represents the fold change of AXIN2 mRNA expression assessed by qPCR relative to wild-type MEC1 cells derived from a single and different clone. n indicates the number of clones assessed for each group. Q represents the FDR adjusted p-value. g MEF2C ChIP-qPCR-based enrichment on distinct regions in the CRISPRed MEC1 cells (n = 6 biological replicates). h ATAC-seq signal on the AXIN2 VCM region of CRISPRed MEC1 cells. The track is the combination of three biological replicates (read sum). Below each track, called peaks for each genotype are displayed. i Dual reporter luciferase assay performed in MEC1 cells to test the enhancer capacity of a 500 bp sequence centered on the indel for both genotypes (n = 4 biological replicates). In f, g, and i, data are presented as the mean ± SD, P represents p-values from an unpaired two-sided Welch’s t-test, corrected for multiple testing by FDR when necessary (defined as Q), and source data are provided as a Source Data file.

