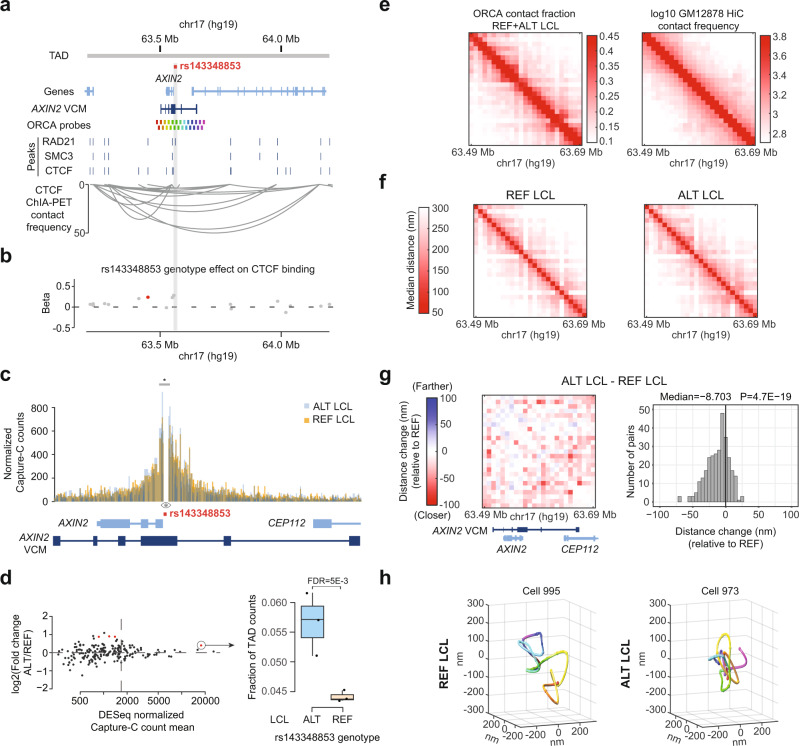
Fig. 6. Global chromatin compaction of the AXIN2 VCM region on the ALT allele.
a Genomic view of the AXIN2 locus showing the GM12878 AXIN2 TAD72, the LCL AXIN2 VCM, the DNA probes used for ORCA, binding sites for RAD21, SMC3, and CTCF in GM12878 from ENCODE, and CTCF ChIA-PET interactions from GM1287849. b Genetic effect (beta) of the rs143348853 genotype on CTCF binding in LCLs. Significant values (FDR < 0.05) are labelled in red based on FDR corrected p-values from a linear regression model. c Histogram of the TAD-normalized Capture-C counts from merged replicates for the ALT and REF LCLs. The viewpoint is marked with an eye (indel) and the significant 5 kb bin with differential interaction between the two alleles is marked with a gray box and * (based on DESeq2 results). d Log2 fold change of ALT vs. REF normalized and binned (bin-size = 5 kb) Capture-C counts as obtained by DESeq2 (FDR < 0.05 highlighted in red) (the vertical line represents the average count per bin across the AXIN2 TAD, used as a signal to noise threshold) (left panel). Boxplot of the fraction of TAD counts falling within the 5 kb bin around the viewpoint, containing the AXIN2 promoter (see c, gray box and *) (n = 3 biological replicates) (right panel). Boxes indicate the IQR (25–75%) and the box center indicates the median. Whiskers represent de minimum or maximum values of no further than 1.5 times the IQR for both the top and bottom of the box. e ORCA contact fraction <150 nm for the merged REF and ALT LCL data (left) and log10 GM12878 HiC contact frequency on the same genomic region (right). f Population-median distance in nm for each pair of ORCA segments for REF and ALT LCLs. g Matrix (left) and histogram (right) showing the differences between pairs of ORCA segments of population-median distances of REF and ALT alleles. P indicates p-value from a two-sided binomial test. h Polymer reconstruction of the LCL AXIN2 VCM 3D architecture obtained by ORCA from one representative LCL single cell for the REF and ALT genotype. The segments are color-coded as illustrated in a.

