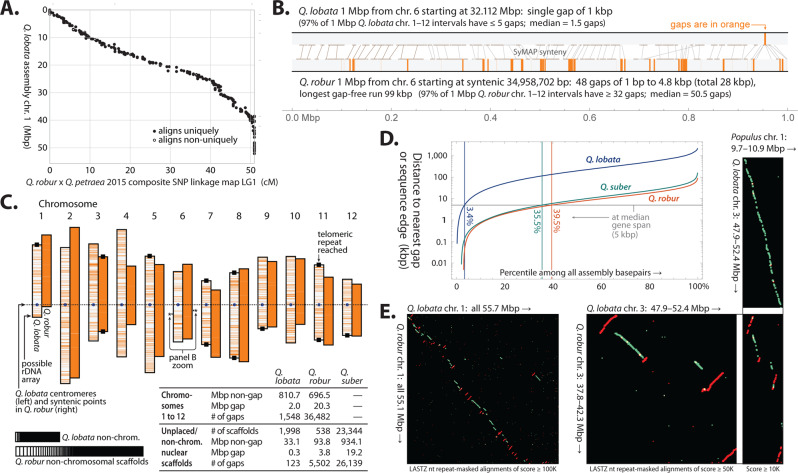
Fig. 1. Overview of assemblies of Q. lobata tree SW786 (version 3.0), Q. robur (version PM1N)6, and Q. suber (version 1.0)12.
A Alignment of a linkage map linkage group 1 to Q. lobata chr. 1, exhibiting high concordance and overall monotonicity. B A representative 1 Mbp region from the Q. lobata assembly (top) and the syntenic 1 Mbp region from the Q. robur assembly (bottom), showing gaps in orange. C Overview of the chromosome-level assemblies (Q. lobata left member of each pair, Q. robur right) with orange lines indicating gaps, and basic statistics for all three assemblies. D Distributions of distance from a random base pair to the nearest gap or sequence edge. E Nucleotide alignments of entire chr. 1 of Q. lobata and Q. robur, showing numerous apparent rearrangements and inversions, in contrast to a more detailed illustrative region between chr. 3 of the two Quercus with chr. 1 of more distant Populus trichocarpa20, in which the Q. lobata assembly is straight-line syntenic with Populus but that of Q. robur is not. Alignments between nominal same/opposite strands are colored green/red.

