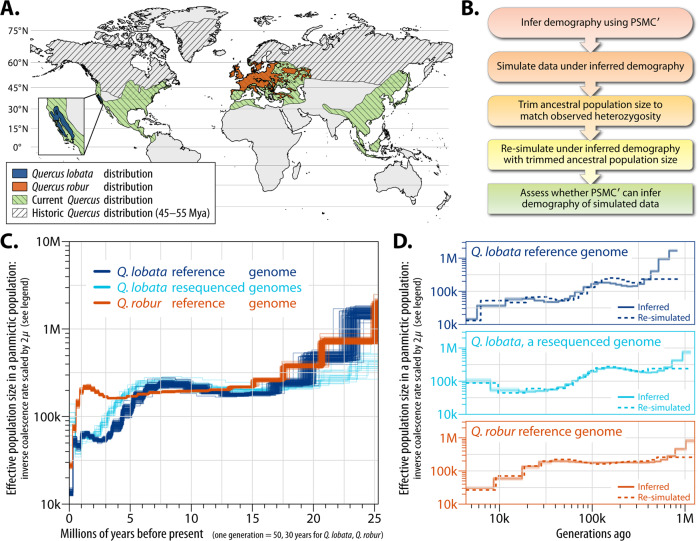
Fig. 2. Demographic evolutionary history analysis of Q. lobata and Q. robur.
A Historic and contemporary species ranges based on Barrón, Averyanova3 and fossil occurrence records from the Global Biodiversity Information Facility website (https://www.gbif.org/, 19 January 2019). Contemporary distribution of Q. robur is from the European Forest Genetic Resources Programme http://www.euforgen.org/species/quercus-robur/); Q. lobata is based on Griffin and Critchfield91. All data and map information are in the public domain. Land boundaries were obtained from NaturalEarthData.com (https://www.naturalearthdata.com/about/terms-of-use/). Quercus spp. records used to reconstruct the historic distribution were obtained from GBIF (GBIF.org, 19 January 2019, GBIF Occurrence Download). The current distribution of Q. robur was from EUFORGEN (http://www.euforgen.org/species/quercus-robur/). Occurrence records used to create the current distribution of Quercus and Quercus lobata were obtained from GBIF (GBIF.org, 22 January 2019, GBIF Occurrence Download)). B Stages of the analysis. C Inferred effective population sizes over time via PSMC′ (100 bootstraps shown per condition), using a mutation rate of 1.01 × 10⁻⁸ bp per generation (see Supplementary Note 4. Demographic analysis, and Supplementary Fig. 6 for other parameters). D PSMC′ accurately infers demography (solid) on data simulated (dashed) under models fit to the empirical data.

