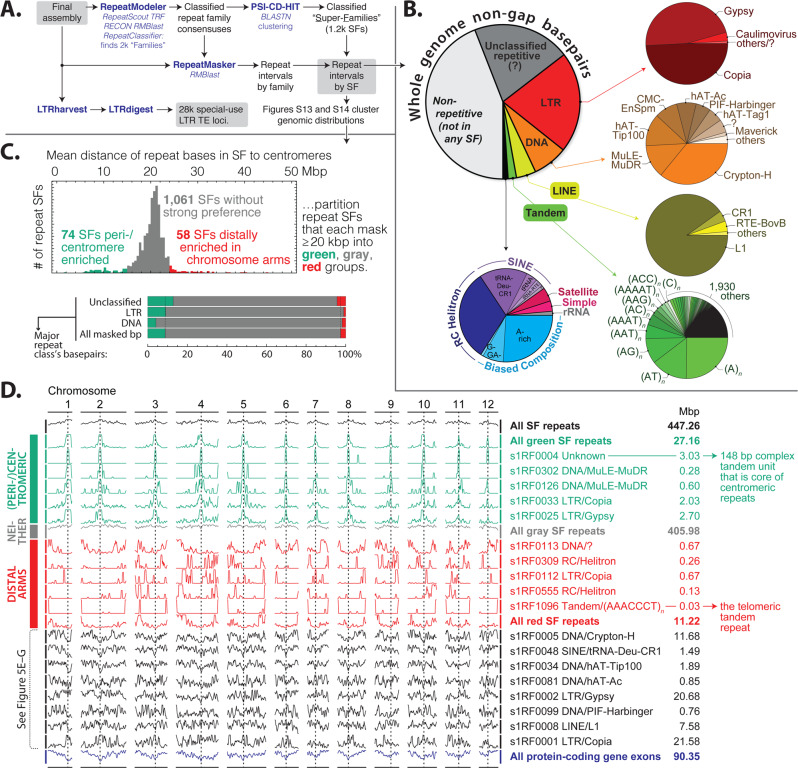
Fig. 3. Dispersed and local (tandem/satellite, simple/biased composition) repetitive sequence in Q. lobata.
A Primary analysis outline. B Assembly partitioned into RepeatClassifier/RepeatMasker major and minor classes; 54% of non-gap base pairs are covered by repeat superfamilies (SFs), and transposable elements (TEs) are prevalent. C Unsupervised comparisons of how the 1193 individual SFs each with ≥20 kbp distribute across chromosomes (Supplementary Figs. 13 and 14) suggest the primary distributional diversity at chromosome scale is proximity to centromeres (green, 74 SFs totaling 27 Mbp) vs. telomeres (red, 58 SFs totaling 11 Mbp) vs. more-or-less uniformity (gray, 1061 SFs totaling 406 Mbp). D Chromosomal distribution of selected SFs and sets of SFs, illustrating the diversity across and within the trichotomy of C. The y-axis in each row is linear number of member base pairs in 3 Mbp bins every 1 Mbp, with zero at the lower edge and 95th percentile (or row maximum if the percentile is zero) at the upper edge. Black rows near the bottom are the representative SFs of Fig. 5E–G.

