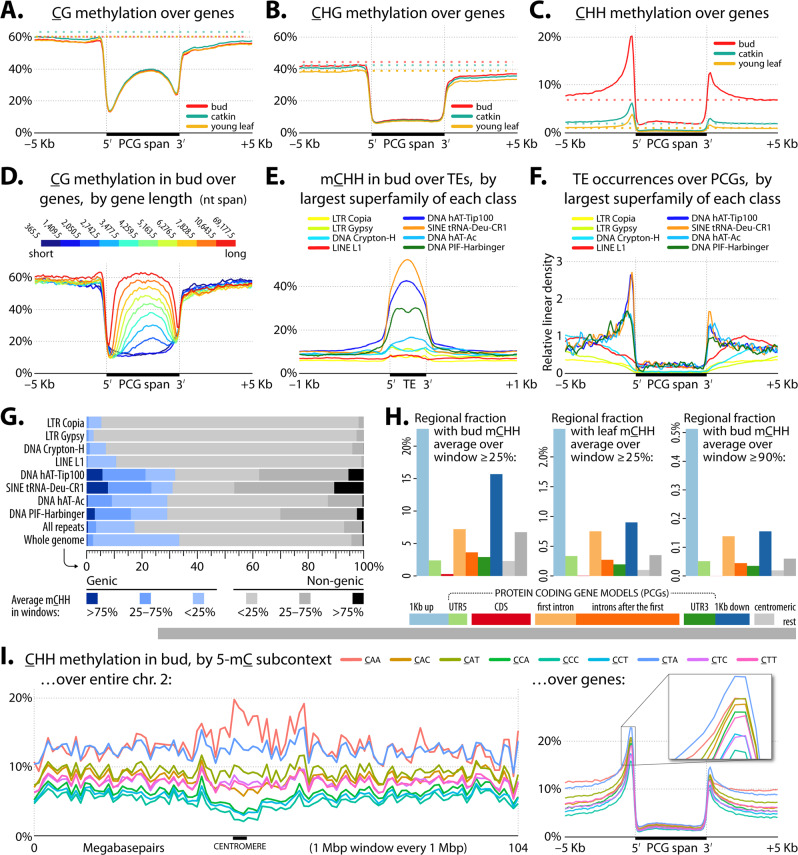
Fig. 5. DNA methylation in protein-coding genes and repeats.
A–C Average methylation levels (100 bp windows, introns included) with respect to PCGs (normalized to 5 kbp long) for the three sampled tissues (bud, catkin, and young leaf) by methylation context: A CG, B CHG, and C CHH. Dotted lines show genome-wide backgrounds, and TSS/TES = transcription start/end site. Supplementary Fig. 18 shows plots with introns excluded. D mCG for genes in deciles by gene length. E Average bud mCHH (20 bp windows) across representative repeat SFs (normalized to 400 bp long) in selected RepeatClassifier minor classes. F Relative density of representative repeat SFs around genes (100 bp windows). G Distribution of mCHH for representative repeat SFs (100 bp sliding disjoint windows). Genic = gene spans enlarged by 1 kbp on each end. H Partitioning of whole-genome base pairs into nine types of regions vs. mCHH coverage. Lower horizontal bars reflect relative size. Vertical bars show the percent of each genomic context covered by 100 bp windows with mCHH >25% or >90% in bud or young leaf. I mCHH by 3 nt subcontext (queried cytosine is underlined, and is the first nt of the three): left side 1 Mbp windows across all of chr. 2, right side across genes (normalized to 5 kbp length) in bud tissue.

