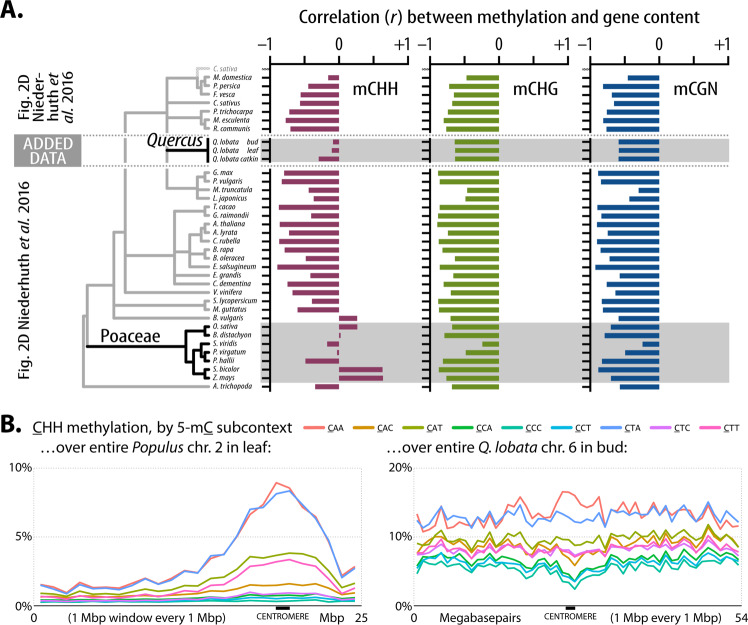
Fig. 6. DNA methylation across chromosomes.
A Pearson correlation (r) between methylation level and the number of genes (100 kbp windows) for mCHH (left), mCHG (middle), and mCG (right) context levels from leaf tissue-based Fig. 2D of Niederhuth et al.36, inserting our data for three oak tissues (bud, leaf, and catkin from tree SW786, having matched analysis details as closely as possible). B Comparison of all nine DNA subcontext methylation levels within the CHH context over an illustrative chromosome of Popular trichocarpa89 and Q. lobata (and see Fig. 5 legend).

