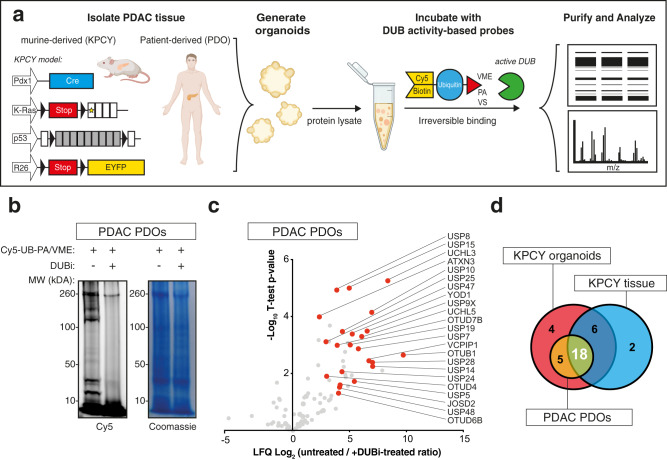
Fig. 1. Characterization of PDAC specific DUBs using activity-based-probe proteomics.
a Schematic overview of ABP experiment performed in PDAC organoids, created with BioRender.com. b In-gel visualization of Cy5-Ub-ABP labeled DUBs in patient-derived organoids (PDO). c Mass spectrometry analysis of DUBs labeled with Biotin-ubiquitin-ABP in PDOs. Volcano blot depicts the label-free quantification (LFQ) of −log10 t-test p-value vs ratio difference of untreated (right side) and DUBi-treated (left side) samples. Gray dots indicate all proteins identified, and red dots highlight all significant DUBs. d Venn diagram summarizing identified DUBs, from mass spectrometry experiments comparing untreated vs DUBi-treated samples. Source data are provided as a Source Date file.

