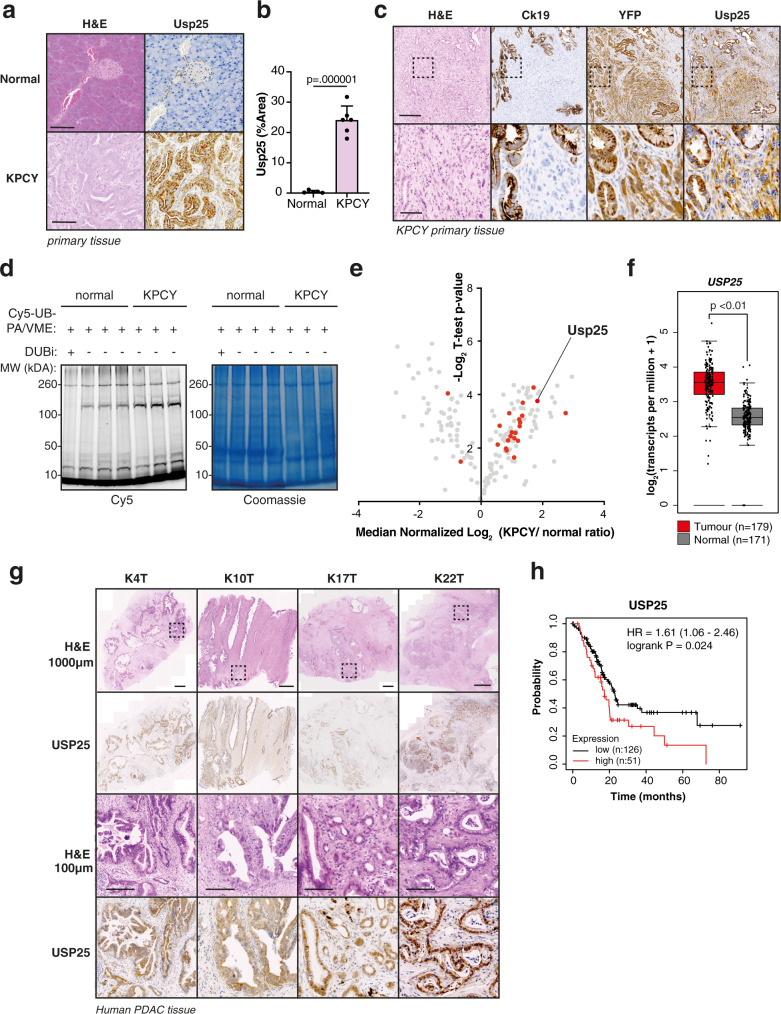
Fig. 3. USP25 is highly expressed and enzymatically active in PDAC compared to normal pancreatic tissue, which correlated with poor patient survival.
a Histological and immunohistochemical analysis of Usp25 expression in normal pancreatic and KPCY tumor tissues. Scale bar is 100 µm. b Quantification of Usp25 positive staining area (n = 6 biologically independent animals per group), displayed as mean ± SD. Statistical significance was determined by two-tailed Student’s t test. c Histological and immunohistochemical analysis of Usp25 expression in KPCY tumor tissue (n = 5 biologically independent animals per group). Scale bar is 1000 µm, insert is 100 µm. d In-gel visualization of Cy5-Ub-ABP labeled DUBs in murine normal pancreatic vs KPCY tumor tissues (n = 3 biologically independent animals per group). e Mass spectrometry analysis of DUBs labeled with Biotin-ubiquitin-ABP in normal pancreatic and KPCY tumor tissue. Biological replicates were averaged and displayed as median normalized −log10 t-test p-value vs ratio difference of normal (left side) and KPCY tumor (right side) samples, and red dots highlight all significant DUBs. f USP25 expression in PDAC tumor and normal tissues based on publicly available TCGA and GTEx RNA-seq datasets, generated using GEPIA online platform, with the parameters log2fold-change cutoff 1 and p-value cutoff 0.01. In box plot, the center line reflects the median. g Histological and immunohistochemical analysis of USP25 staining in primary patient PDAC tumors. Scale bar is 100 µm. h Kaplan–Meier survival plot of PDAC patients expressing above (n = 51, red) or below (n = 126, black) levels of USP25, generated using the Kaplan-Meier plotter online platform. Vertical ticks represent censored events; logrank p = 0.024, two-tailed log-rank test. Source data are provided as a Source Date file.

