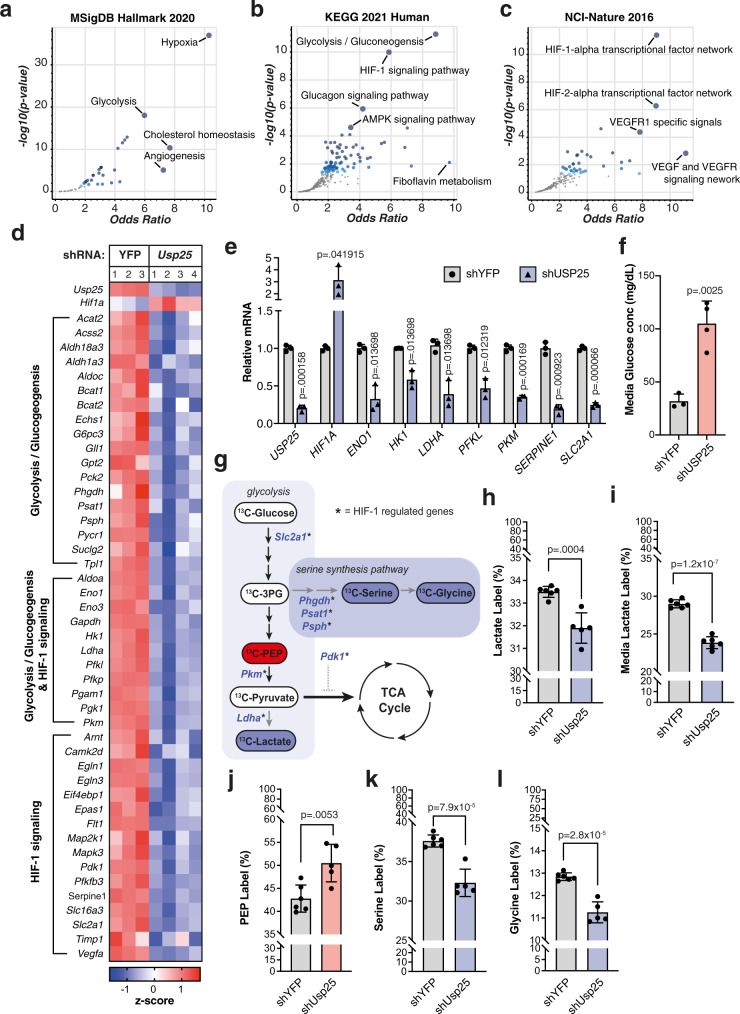
Fig. 5. Transcriptional and metabolomic profiling of PDAC organoids reveals USP25 as a novel regulator of HIF-1 transcriptional activity and metabolic rewiring.
a–c Pathway analysis from (a) MSigDB Hallmark 2020, (b) KEGG 2021 Human, and (c) NCI-Nature 2016 datasets of differentially expressed genes downregulated upon loss of Usp25. The volcano plot shows the significance of each gene set from the selected library versus its odds ratio. Larger blue points represent significant terms (p-value < 0.05); smaller gray points represent non-significant terms. The darker the blue color of a point, the more significant it is. d Heatmap of gene expression z-scores for top KEGG pathways. e Gene expression in PDOs displayed as relative mRNA expression compared to shYFP controls. Each symbol represents independent shRNAs targeting either YFP (black circles) or USP25 (black triangles), averaged from biologically independent experiments (n = 3), and displayed as mean ± SD. Statistical significance was determined by two-tailed Student’s t test with Holm–Sidak post-hoc correction for multiple testing. f Glucose concentrations measured in culture medium from PDO (n = 3 biologically independent experiments), displayed as mean ± SD. Statistical significance was determined by two-tailed Student’s t test. g Schematic of 13C-glucose enrichment analysis in KPCY organoids treated with shUsp25, with downregulated HIF-1 target genes in blue and measured metabolites that are unchanged (white), downregulated (blue) or enriched (red) compared to shYFP-treated organoids. h–l Incorporation of 13C-glucose into (h) intracellular lactate, (i) secreted lactate in the culture media, (j) intracellular PEP, (k) intracellular serine, and (l) intracellular glycine in treated KPCY organoids. Data in (h–l) is displayed as mean ± SD, and represents one experiment carried out with six replicates. Due to technical limitations, statistics for (h–l) were performed on technical replicates using two-tailed Student’s t test. Source data are provided as a Source Date file.

