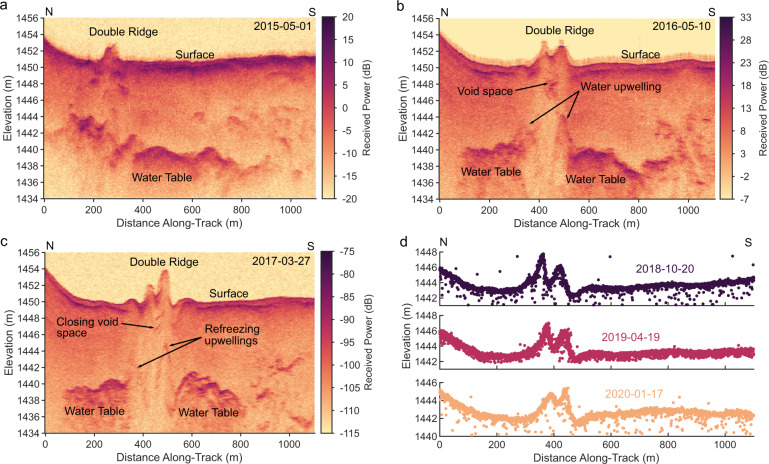
Fig. 3. Time series of high-resolution radargrams and ICESat-2 laser altimetry showing the evolution of the double ridge system.
In panels a–c, the color scale shows the relative received radar power with darker colors indicating stronger returns. In panel d, the surface elevation profiles are color-coded by collection date. a Radargram collected in May 2015. The water table is continuous and the southern ridge has not yet developed. b Radargram collected in May 2016. This radargram shows the full double ridge, underlain by the divided and upwelling water table, along with scattering from likely void space beneath the central trough. c Radargram collected in March 2017. The system morphology remains generally stable, with reduced reflectivity in the upwelling water table and void spacing, suggesting freeze-out and creep closure. d ICESat-2 surface elevation profiles collected over the ridge in October 2018 (dark purple), April 2019 (light purple), and January 2020 (orange). These plots show high-quality (level 4) photons from ground track 331. Apparent changes in ridge cross-section may be the result of along-strike variations in ridge structure as the ridge is advected ~106 ma−1 under the fixed satellite track.

