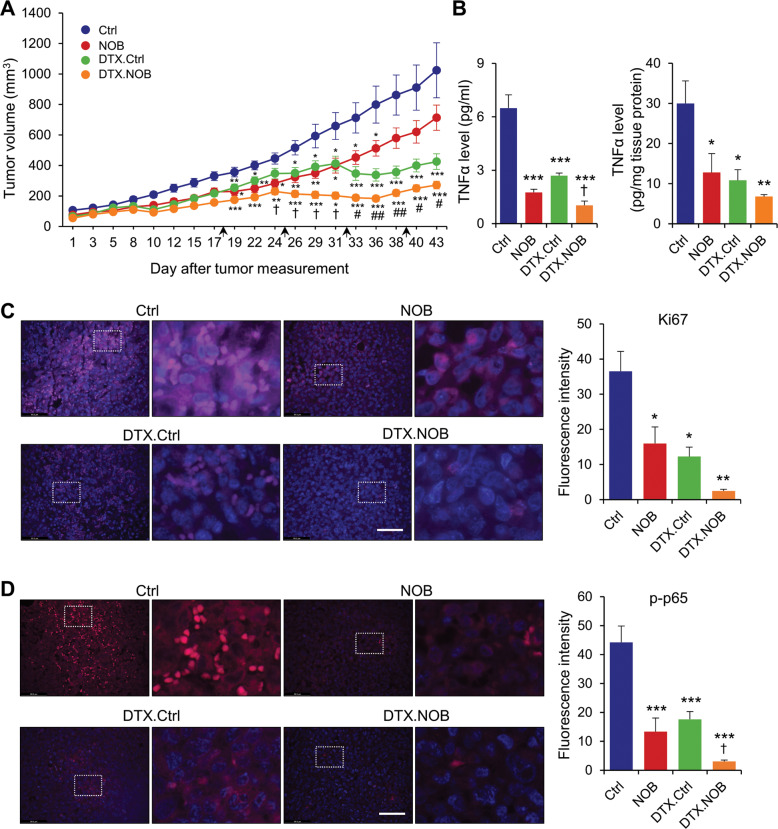
Fig. 7. NOB suppresses tumorigenesis in MDA-MB-231 xenograft mice.
A DTX and NOB showed synergistic inhibitory effects in MDA-MB-231 xenograft tumor growth (n = 6 for Ctrl and NOB, n = 7 for DTX.Ctrl, and n = 8 for DTX.NOB). The black arrows show DTX injection time point (18, 25, 32, 39 days). Data represent mean ± SEM. Two-way ANOVA with Tukey’s multiple comparisons test showed significant difference compared to Ctrl, *p < 0.05, **p < 0.01, and ***p < 0.001, compared with NOB, #p < 0.05 and ##p < 0.01, and compared with DTX.Ctrl, †p < 0.05, CI = 1.22. B TNF-α levels in plasma (left panel) and tumor (right panel) of MDA-MB-231 xenograft mice model. Data represent mean ± SEM. Two-way ANOVA with Tukey’s multiple comparisons test showed significant difference compared to Ctrl, *p < 0.05, **p < 0.01, and ***p < 0.001 and compared to DTX.Ctrl, †p < 0.05. C Representative immunofluorescence images of the Ki67 (pink) and DAPI (blue) (×400 magnification, scale bar = 69.3 μm). Quantitative analysis of the percentage of Ki67 immunoreactive area. Data represent mean ± SEM. Two-way ANOVA with Tukey’s multiple comparisons test, *p < 0.05 and **p < 0.01. D Representative immunofluorescence images of the p-p65 (pink) and DAPI (blue) staining from representative images of the p-p65 (red) and DAPI (blue) immunofluorescence in the lesion area (×400 magnification, scale bar = 69.3 μm). Quantitative analysis of the percentage of p-p65 immunoreactive area. Data represent mean ± SEM. Two-way ANOVA with Tukey’s multiple comparisons test showed significant difference compared to Ctrl, ***p < 0.001 and compared to DTX.Ctrl, †p < 0.05.

