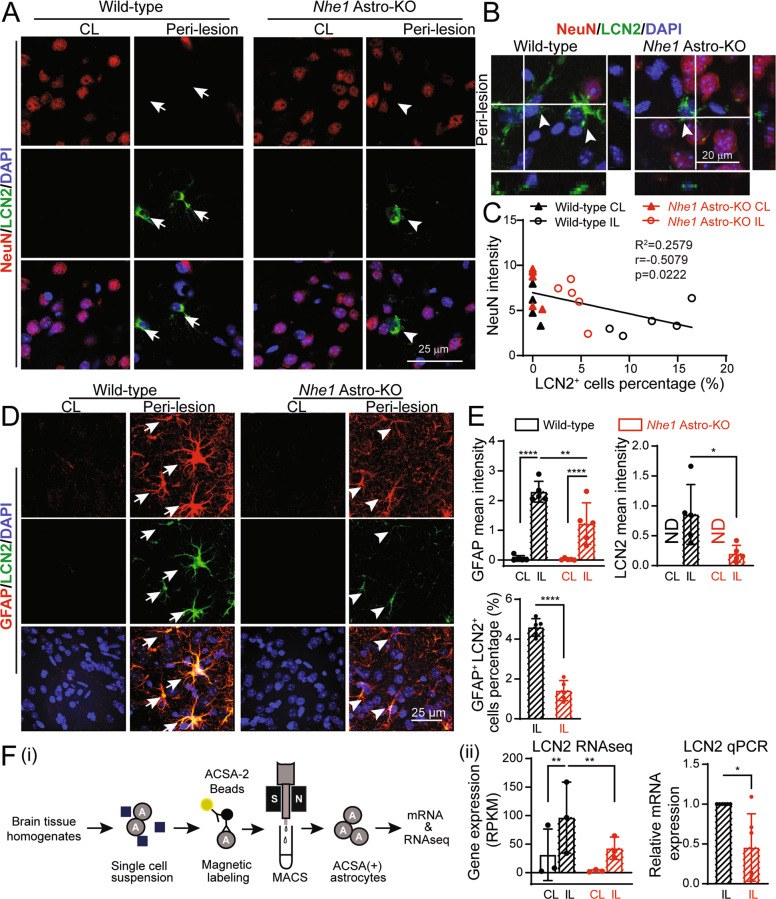
Fig. 2. Stroke-induced LCN2 expression in RA is negatively associated with NeuN+ neuronal counts.
A Representative confocal images of NeuN and LCN2 expression in astrocytes at 48 h Rp. Arrows: high expression. Arrowheads: low expression. B Orthogonal sections from z stack confocal images showing association of NeuN+ neurons with LCN2+ astrocytes (arrows). C Negative correlation between LCN2 expression and NeuN+ intensity in wild-type and Nhe1 Astro-KO brains. r = −0.5079, p = 0.0222. D Representative confocal images of GFAP and LCN2 expression in astrocytes at 48 h Rp. Arrows: high expression. Arrowheads: low expression. E Summary data shows quantification of GFAP and LCN2 fluorescence signal intensity and summary data of GFAP and LCN2 double positive cells percentage. Data are mean ± SD, n = 5. *p < 0.05; **p < 0.01; ***p < 0.001; ****p < 0.0001 via one-way ANOVA and unpaired t-test. F (i) Cartoon illustrates isolation of astrocyte by MACS. (ii) Relative gene expression of LCN2 expressed as RPKM normalized values and RT-qPCR analysis of changes in expression of LCN2 mRNA in the astrocytes isolated from wild-type and Nhe1 Astro-KO brains at 24 h Rp. Data are mean ± SD n = 6, *p < 0.05 by unpaired t-test.

