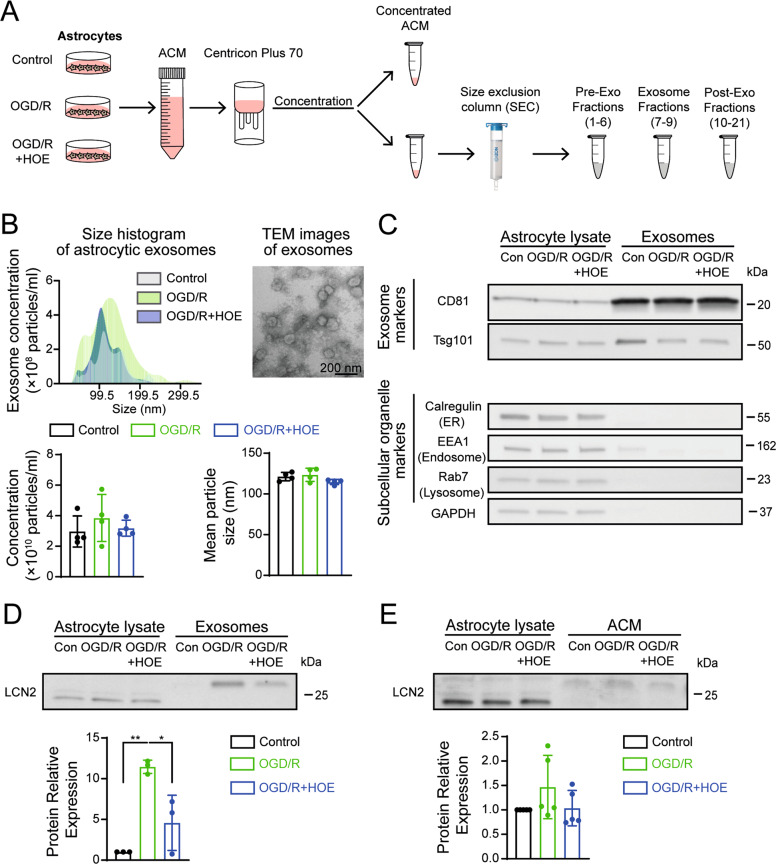
Fig. 4. In vitro ischemia-induced differential changes in exosome LCN2 expression in primary astrocytes in presence or absence of HOE642.
A Cartoon illustrates ACM concentration and exosomes isolation. B Representative size distribution of exosomes isolated from ACM of control, OGD/R and OGD/R + HOE642 treated astrocytes by NTA and representative TEM images of exosomes. Bar graph represents the quantification of exosome concentration and mean particle size. Data are mean ± SD, n = 4. C Representative immunoblots of exosome markers and other subcellular organelles specific protein markers in whole-cell lysates and purified exosome fractions. D Representative immunoblots of LCN2 in whole-cell lysate and exosome fractions. Bar graph represents the quantification of LCN2 band intensity. Data are mean ± SD, n = 3. *p < 0.05; **p < 0.01 via one-way ANOVA. E Representative immunoblots and quantification of LCN2 expression from astrocyte lysate and ACM isolated from control, OGD/R and OGD/R + HOE642 treated astrocytes. Data are mean ± SD, n = 4. *p < 0.05; **p < 0.01; ***p < 0.001 via one-way ANOVA.

