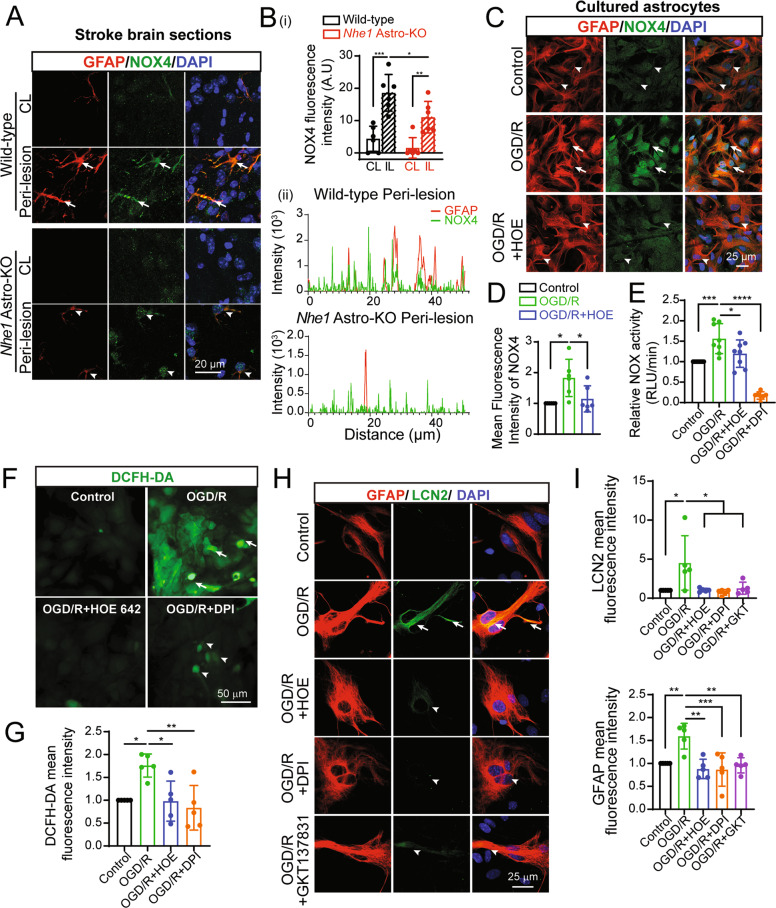
Fig. 6. Increased NOX4 expression and NOX activity in ischemic astrocytes.
A Representative confocal images of NOX4 and GFAP expression in astrocytes at 48 h Rp. Arrows: high expression. Arrowheads: low expression. B (i) Summary data shows quantification of NOX4 fluorescence signal intensity in GFAP+ astrocytes. (ii) Fluorescence intensity profiles of NOX4 and GFAP signals generated across the image. Note the increased overlap of the NOX4 and GFAP signals in wild-type brains. Data are mean ± SD, n = 6. *p < 0.05; **p < 0.01; ***p < 0.001 via one-way ANOVA. C Representative confocal images of NOX4 and GFAP expression in control, OGD/R and OGD/R + HOE642 treated astrocytes in cultures. Arrows: high expression. Arrowheads: low expression. D Summary data shows quantification of NOX4 fluorescence signal intensity in GFAP+ astrocytes. Data are mean ± SD, n = 6. *p < 0.05 via one-way ANOVA. E NOX activity detected using lucigenin chemiluminescence assay and expressed as relative luminescence unit (RLU)/min. Data shown are expressed as mean ± SD, n = 8. *p < 0.05; **p < 0.01; ***p < 0.001; ****p < 0.0001 via one-way ANOVA. F Representative DCFH-DA fluorescent images of normoxic, OGD/R, OGD/R + HOE642 and OGD/R + DPI treated astrocytes in cultures. Arrows: high expression. Arrowheads: low expression. G Summary data shows quantification of DCFH-DA fluorescence signal intensity in astrocytes. Data are mean ± SD, n = 5. *p < 0.05; **p < 0.01 via one-way ANOVA. H Representative confocal images of LCN2 and GFAP expression in control, OGD/R, OGD/R + HOE642, OGD/R + DPI and OGD/R + GKT137831 treated astrocytes in cultures. Arrows: high expression. Arrowheads: low expression. I Summary data shows quantification of LCN2 and GFAP fluorescence signal intensity in astrocytes. Data are mean ± SD, n = 5. *p < 0.05; **p < 0.01; ***p < 0.001 via one-way ANOVA.

