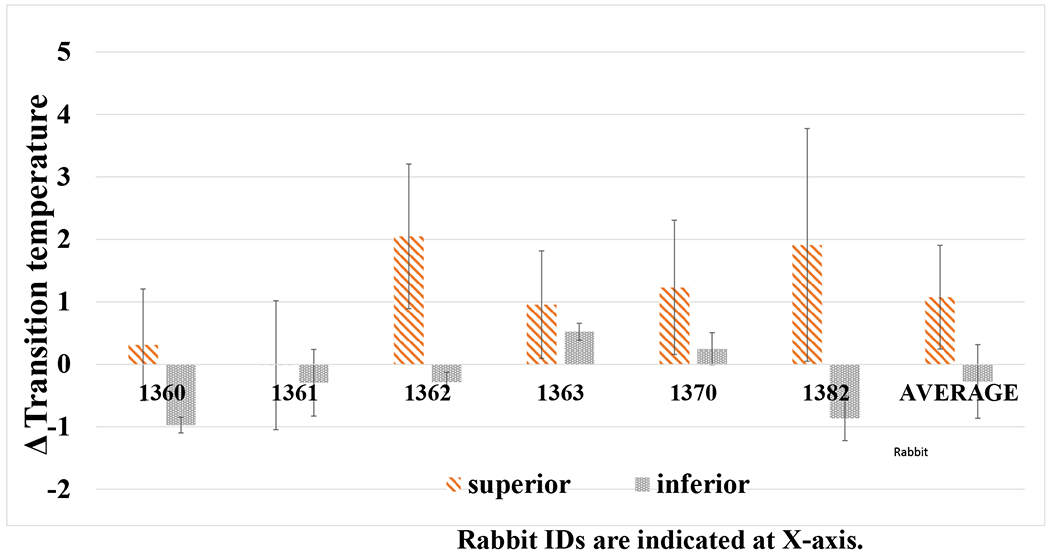
Figure 2.

Difference in denaturation temperature (ΔTm) of the difference top versus bottom G2 sclera punches and average ΔTm after treatment with 40 mM SMG containing HPMC (15 cP). Each set of bars represent an individual rabbit (1360, etc., labeled accordingly below) and is the Tm difference between right (treated) and left (control) globes. The average of all 6 animals is shown to the right. Rabbit identification numbers are indicated on the x-axis.
