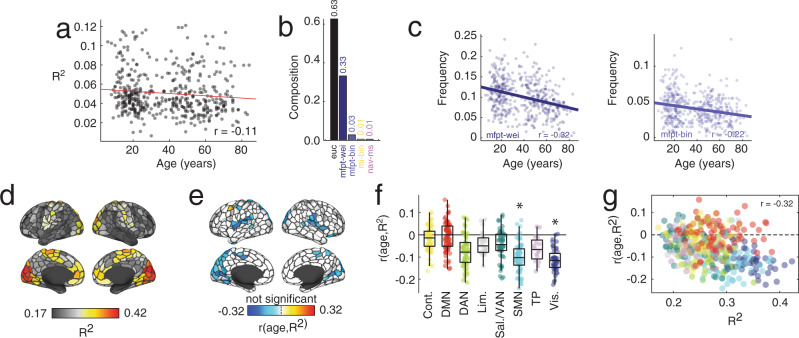
Fig. 6. Lifespan variation in structure-function coupling based on communication models.
a Decreases in whole-brain variance explained across the lifespan. b Distribution of optimal predictors for each subject across the lifespan. c Correlations between age and the frequency with this weighted and binary mean first passage time were the optimal predictor of regions' FC patterns. d Whole-brain pattern of variance explained. e Correlation of variance explained with age projected onto the cortical surface. f Correlation of variance explained grouped by brain system (asterisks indicate statistical significance). Each point represents a brain region (N = 400 parcels defined based on40). In each boxplot, the “box” denotes interquartile range (IQR), the horizontal bar indicates the median value, and the whiskers include points that are within 1.5 × IQR of upper and lower bounds of the IQR (25th and 7th percentiles). Any points that fall beyond the whiskers are, by convention, considered outliers. g Scatterplot of variance explained versus the correlation of variance explained and age. Source data are provided as a Source Data file.

