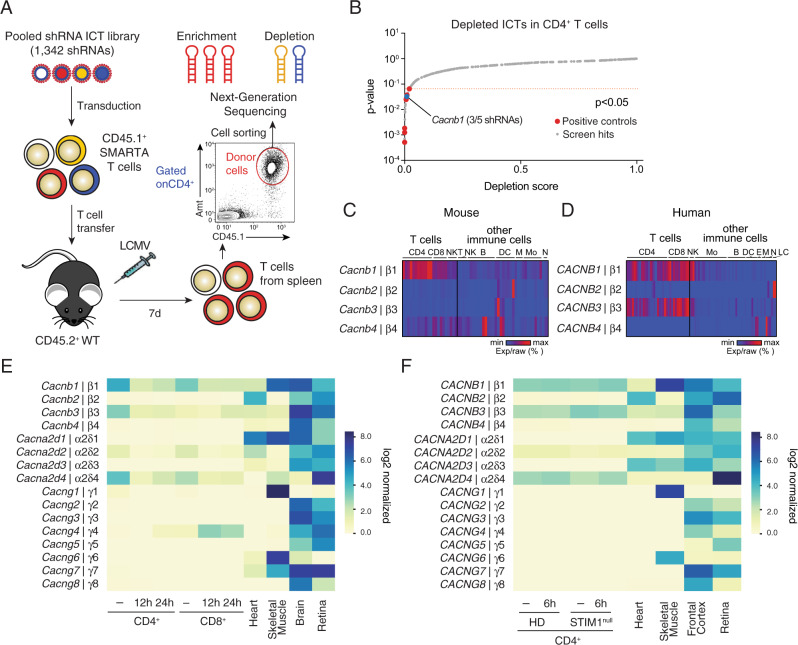
Fig. 1. shRNA screen identifies Cacnb1 as a regulator of antiviral T cell responses.
A In vivo ion channels and transporters (ICT) screen. CD4+ T cells from SMARTA mice were transduced with a pooled shRNA library targeting 223 ICTs (1342 shRNAs including control shRNAs), enriched by cell sorting for transduced (Ametrine+) cells and injected into host mice. 7 days after infection with LCMVARM, CD4+CD45+Amt+ donor T cells were isolated from host spleens and analyzed by next generation sequencing (NGS) for the depletion or enrichment of shRNAs. B Scores of depleted shRNAs and their p values calculated based on the negative-binomial model using the MAGeCK software package88. Cacnb1 (blue dot), other ICTs (gray) and positive controls (red) are indicated. Shown are the pooled data from three independent screens. C, D mRNA expression of Cavβ subunits in mouse (C) and human (D) T cells compared to other immune cells based on data from ImmGen27 and Fantom528,29 databases. Each column represents a different type of immune cell. Heatmaps represent % raw min-max expression for each gene. NK natural killer, NKT natural killer T, Mo monocyte, B B cell, DC dendritic cell, E eosinophil, M macrophage, N neutrophil, LC Langerhans cell. E, F Absolute mRNA expression of auxiliary β, α2δ and γ subunits of VGCCs in mouse (E) and human (F) T cells and reference tissues. Mouse CD4+ and CD8+ T cells were left unstimulated (−) or stimulated for 12 or 24 h with anti-CD3 + CD28 antibodies. Human CD4+ T cells were left unstimulated (−) or stimulated for 6 h with anti-CD3 + CD28 antibodies. mRNA expression was analyzed by RNA sequencing. HD represents the averaged data from three individual healthy donors (HD) and a patient with a STIM1 null mutation (STIM1null). RNA-Seq for mouse T cells and for human and mouse heart, skeletal muscle, brain, frontal cortex, and retina were extracted from GEO datasets (Supplementary Table 2).

