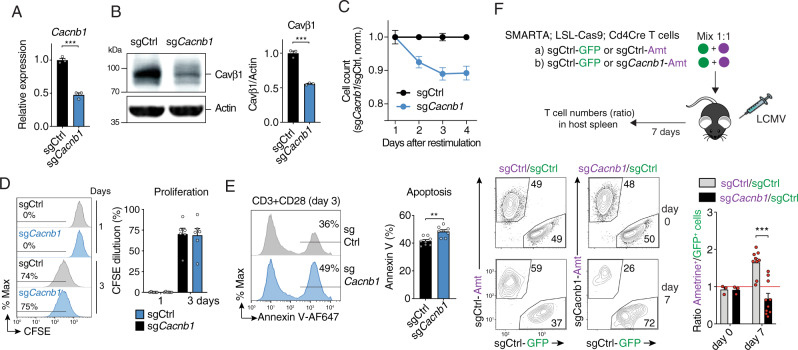
Fig. 2. Deletion of Cavβ1 impairs viability of CD4+ T cells and their expansion after viral infection.
A mRNA expression of Cacnb1 in CD4+ T cells of LSL-Cas9; Cd4Cre mice transduced with control sgRNA (sgCtrl) and sgRNA targeting Cacnb1. mRNA levels were measured in transduced (Ametrine+) T cells by qPCR at day 3 post-transduction. Rlp32 was used as housekeeping control. sgCacnb1 samples were normalized to sgCtrl. B Representative Western blot (left) and quantification (right) of Cavβ1 protein in CD4+ T cells transduced with sgCtrl or sgCacnb1. After 4–5 days, Cavβ1 was detected using a monoclonal antibody recognizing aa 19-34 in the N-terminus of Cavβ1. Data in (A, B) are the mean ± SEM of n = 3 mice from independent experiments. C–E CD4+ T cells from LSL-Cas9; Cd4Cre mice were transduced with sgCtrl or sgCacnb1 and at day 4 restimulated with anti-CD3 + CD28. C Cell counts shown as the ratio of sgCacnb1 / sgCtrl transduced T cells normalized to non-transduced T cells. D Representative flow cytometry plots (left) and quantification (right) of CFSE dilution at 1 and 3 days after re-stimulation. E Representative flow cytometry plots (left) and quantification (right) of apoptosis measured by annexin V staining at 3 days after re-stimulation. Data in (C–E) are the mean ± SEM of n = 6 mice (in C, D) and n = 8 mice (in E). F Adoptive transfer of CD4+ T cells from SMARTA LSL-Cas9; Cd4Cre mice that has been transduced with sgCtrl or sgCacnb1 followed by LCMVARM infection. Transduced donor T cells were mixed at 1:1 ratio before injection. At day 7 post-infection, the ratios of sgCacnb1/sgCtrl T cells (and sgCtrl/sgCtrl) were analyzed. Representative flow cytometry plots (bottom left) and quantification (bottom right) of T cell ratios. Data are the mean ± SEM from n = 3 independent experiments pooled from n = 3 donor SMARTA; LSL-Cas9; Cd4Cre mice and n = 10 WT host mice per group. Statistical analysis was conducted by two-tailed, unpaired Student’s t test. **p < 0.01, ***p < 0.001.

