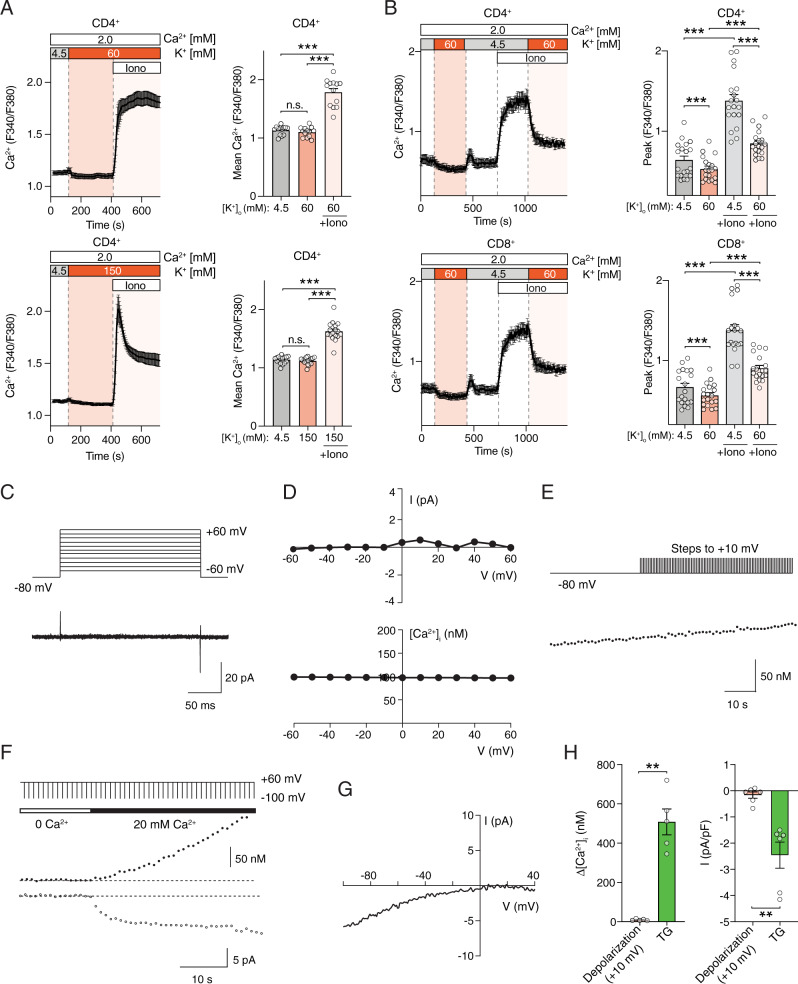
Fig. 4. Depolarization of T cells fails to evoke Ca2+ influx and Ca2+ currents.
A Cytosolic Ca2+ levels in mouse CD4+ T cells. T cells were stimulated with anti-CD3 + CD28, cultured for 3 days and exposed to 60 mM (top) and 150 mM (bottom) KCl followed by stimulation with ionomycin (Iono). B Cytosolic Ca2+ levels in human T cells from a healthy donor (HD) cultured for 10 days in vitro, exposed to 60 mM KCl and stimulated with ionomycin. Averaged Ca2+ traces (left) and quantification (right) of the mean F340/F380 ratio during the time periods indicated by dotted lines. Data shown are the mean ± SEM of n = 3–4 (in A) and n = 7 (in B) independent experiments conducted in duplicates. C–H No voltage-gated Ca2+ currents and signals in human T cells. C Membrane currents in HD T cells were recorded in 110 mM Ba2+ in response to voltage steps from −60 to +60 mV for 200 ms from a holding potential of −80 mV. Current traces were leak-subtracted using the P/8 method with steps from −100 mV. D Current-voltage (I–V) plots (top) and [Ca2+]i concentrations (bottom) measured using Indo-1 in the same cell stimulated in the presence of 20 mM extracellular Ca2+ using the voltage protocol shown in (C). E [Ca2+]i was measured in Indo-1 loaded HD T cells held at −80 mV for 20–30 s to establish the baseline [Ca2+]i followed by application of 40-50 depolarizing steps to +10 mV every 1 s. F, G Simultaneous measurements of [Ca2+]i and ICRAC. F T cells pretreated with TG were exposed to a step-ramp voltage protocol comprising a −100 mV step (50 ms) followed by a ramp from −100 to +100 mV (50 ms) every 1 s. The holding potential was +60 mV to prevent Ca2+ influx during the interpulse interval. G Representative I–V plot typical of ICRAC recorded during the −100 mV pulse from the experiments shown in (F). H [Ca2+]i rises (left) and current densities (right) in response to either depolarizing steps (+10 mV) or TG treatment. For details see Methods. Data in (C–H) represent the mean ± SEM from n = 5–6 cells per condition. Statistical analysis by two-tailed, unpaired Student’s t test. **p < 0.01, ***p < 0.001.

