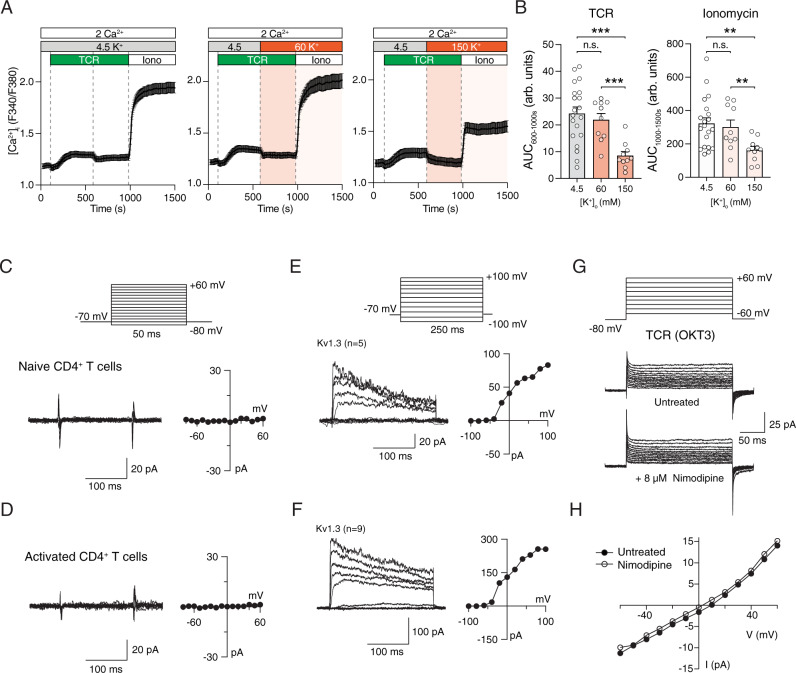
Fig. 5. Lack of voltage-dependent Ca2+ influx and Ca2+ current in T cells after simultaneous TCR stimulation.
A, B Cytosolic Ca2+ levels in CD4+ T cells isolated from WT C57BL/6 mice. T cells were stimulated by anti-CD3 (TCR) crosslinking followed at 600 sec by exposure to Ringer’s solution containing either 4.5 mM (left), 60 mM (middle) or 150 mM (right) KCl. Stimulation with ionomycin (Iono) at 1000 s was used as positive control. A Averaged Ca2+ traces and (B) quantification of the area under the curve (AUC) during the indicated recording periods. Data represent the mean ± SEM of n = 5 experiments conducted in duplicates. C, D No voltage-activated Ca2+ currents are detectable in naïve (C) and expanded (D) mouse T cells. The membrane voltage was stepped from −80 to +60 mV in increments of 10 mV for 50 ms from a holding potential of −70 mV. Currents were leak-subtracted by collecting traces for the same voltage steps in the presence of 100 µM LaCl3. The current-voltage plot is shown on the right in each case. E, F Voltage-activated K+ currents (Kv1.3) in naïve (E) and activated (F) mouse T cells. Kv currents were elicited by depolarizing steps from −100 and +100 mV in increments of 20 mV from a holding potential of −70 mV. The right plot shows the I–V relationship of the recorded Kv currents. Currents were leak-subtracted using the P/8 method. G, H Depolarization fails to induce voltage-gated Ca2+ current in activated T cells. G Human T cells from a healthy donor (HD) were stimulated with anti-CD3 antibodies (OKT3) and membrane currents were recorded in extracellular Ringer’s solution containing 110 mM Ba2+. Displayed are the raw current traces (without leak subtraction) in response to depolarizing voltage stimuli from −60 to +60 mV in steps of 10 mV for 200 ms from a holding potential of −80 mV. To identify VGCC currents, OKT3-stimulated HD T cells were left untreated or treated with 8 μM nimodipine. H I–V plot of cells shown in (G) in the absence (black circles) or presence (open circles) of nimodipine. Data in (C–H) are representative of the following number of cells analyzed: n = 16 (C), n = 14 (D), n = 5 (E), n = 9 (F), n = 3 (G, H). Statistical analysis in (B) by two-tailed, unpaired Student’s t test. **p < 0.01, ***p < 0.001.

