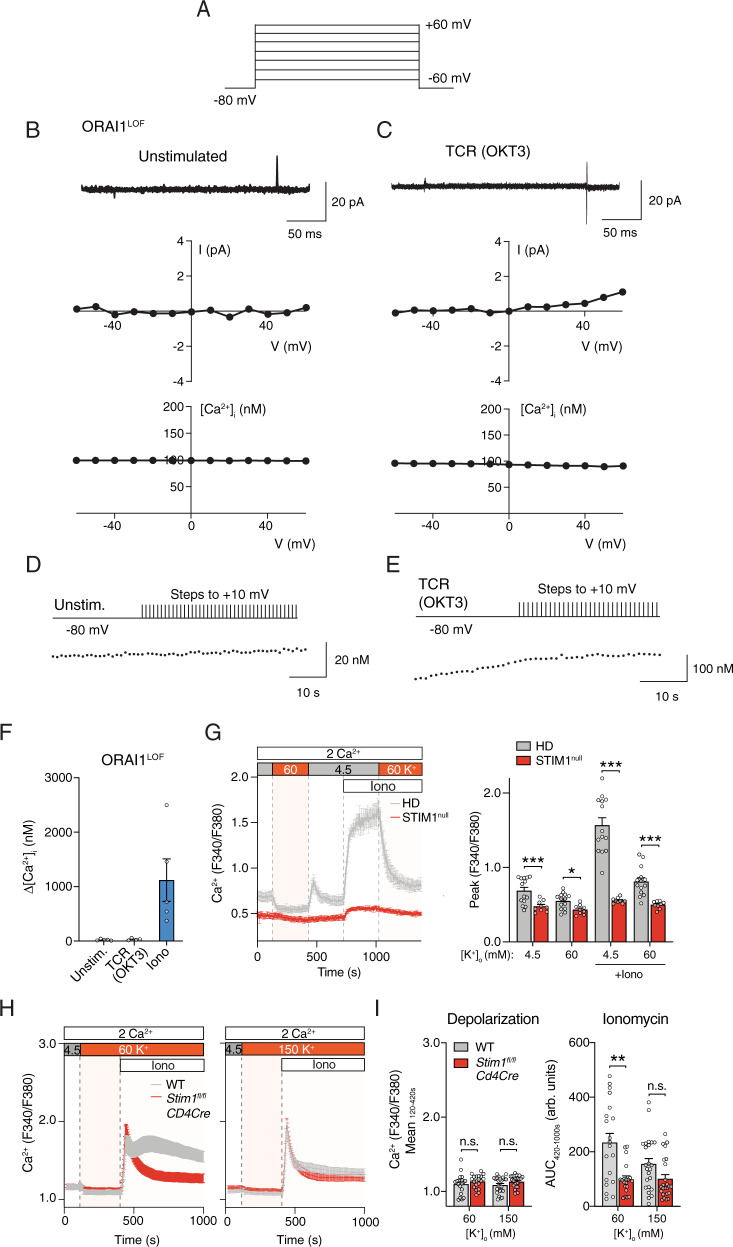
Fig. 6. Lack of ORAI1 or STIM1 does not induce voltage-gated Ca2+ current or Ca2+ influx in T cells.
A–C Perforated patch recordings of human T cells from a patient with a loss-of-function (LOF) mutation (p.R91W) in ORAI1 (ORAI1LOF). T cells were left untreated (B) or stimulated with OKT3 (C) for 5–25 min prior to measurements. To record Ca2+ current and cytosolic Ca2+ levels, T cells were stepped from −60 to +60 mV for 200 ms from a holding potential of −80 mV. Displayed are membrane currents (top), I–V plots (middle) and [Ca2+]i traces (bottom) measured simultaneously in the same cells in 20 mM Ca2+ solution. Currents were leak-subtracted using the P/8 method. Data shown in (B, C) are representative of n = 7 and n = 3 cells, respectively. D, E T cells of the ORAI1LOF patient were loaded with Indo-1 and either left unstimulated (D) or stimulated with OKT3 (E). T cells were stepped to +10 mV for 200 ms every second from a holding potential of −80 mV. Ca2+ traces in (D, E) are representative of n = 5 and n = 4 cells, respectively. F Quantification of [Ca2+]i at +10 mV in unstimulated and OKT3-stimulated T cells and after treatment with 5 μM ionomycin (Iono). Δ[Ca2+]i was measured as the difference between the [Ca2+]i prior to and at the end of 30 depolarization pulses. Data shown are the mean ± SEM from n = 4–5 cells. G Cytosolic Ca2+ levels in human T cells from a patient with a STIM1 c.497 + 776 A > G null mutation (STIM1null). T cells were cultured for 10 days in vitro, loaded with Fura-2 and depolarized with Ringer’s solution containing 60 mM KCl. Averaged Ca2+ traces (left) and quantification (right) of the peak F340/F380 ratios during the time periods indicated by dotted lines. Data are the mean ± SEM from n = 5 independent experiments. (Note that Ca2+ traces of the HD T cells are the same as those shown in Fig. 4B; HD T cells were analyzed together with STIM1null T cells and are shown for comparison). H, I Cytosolic Ca2+ levels in CD4+ T cells from wildtype (WT) and Stim1fl/flCd4Cre mice. T cells were activated for 3 days with anti-CD3/CD28 and then depolarized with Ringer’s solution containing 60 mM or 150 mM KCl. H Averaged Ca2+ traces and (I) quantification of the mean (left) and AUC (right) of F340/F380 ratios during the indicated time periods. Data represent the mean ± SEM from n = 5 independent experiments. Statistical analysis by two-tailed Mann–Whitney U test. *p < 0.05, **p < 0.01, ***p < 0.001.

