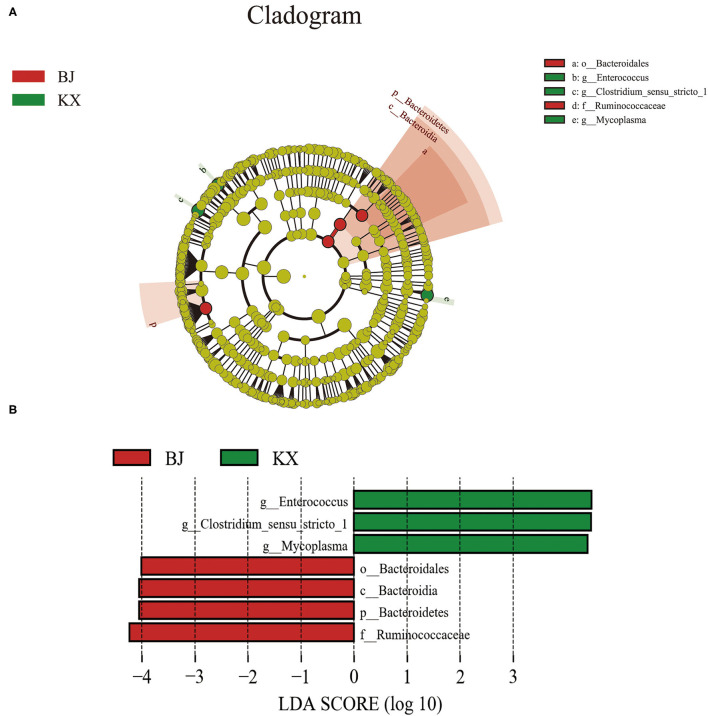
Figure 6.
Linear discriminant analysis (LDA) effect size (LEfSe) analysis. (A) The microbial species had significant differences in the two breeding sites. Different colors presents different groups, the species classification at the level of genus, family, order, class, and phylum were exhibited from the outside to the inside. (B) The plot from LEfSe analysis. The length of the bar column represents the LDA score. The figure exhibited the microbial with significant differences between the two breeding grounds (LDA score > 4.0).

