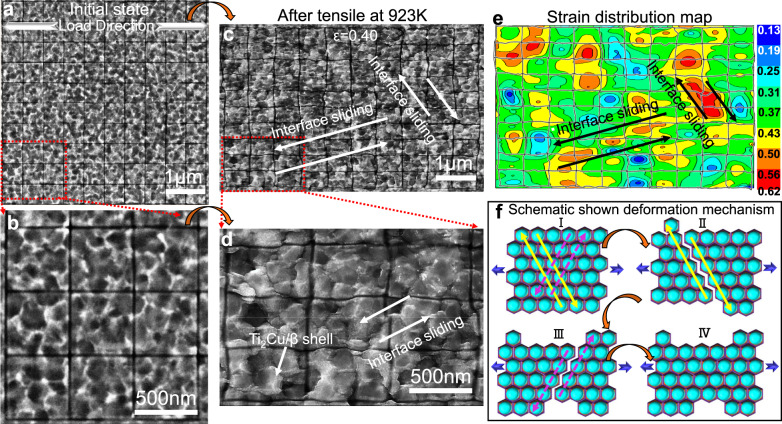
Fig. 4. In-situ scanning electron microscopy (SEM) observation performing on a fiducial marked sample in the 923 K tensile test.
a, b SEM images of the sample before tensile test, shells of α grains can be viewed. c, d SEM images of the sample after tensile to the strain of 0.4, the bending of fiducial markers denotes phase interface sliding taking place. e A strain distribution map, regions with larger strains correspond to where significant phase interface slip happens. f Schematic flowchart of the superplastic mechanism in the Ti6Al4V5Cu alloy: I, Initial state; II, Phase boundary sliding in one tangential direction (yellow arrows); III, Phase boundary sliding in another equivalent tangential direction (purple arrows); IV, Alternating phase boundary sliding in different tangential directions sustains superplastic deformation along the loading direction, while Ti2Cu/β shells suppress grain coarsening during the deformation.

