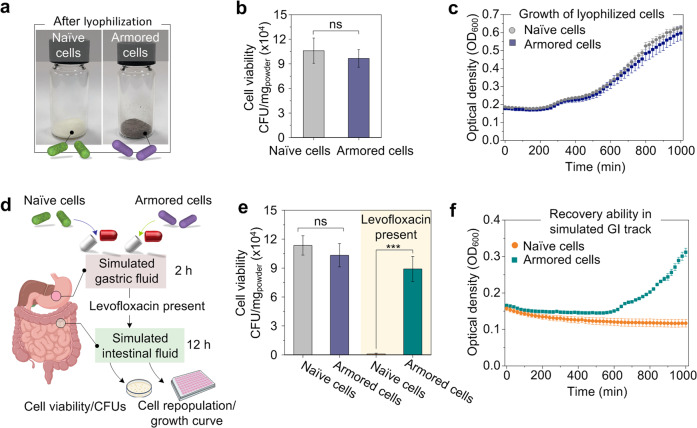
Fig. 4. Encapsulation of lyophilized bacteria and cell recovery in simulated GI conditions.
a Images of lyophilized powders of naïve EcN and armored EcN. b CFU of naïve or armored EcN after lyophilization. Statistical comparisons were performed using two-tailed unpaired t-tests (n = 3), p = 0.559161 > 0.05. c Growth curve of naïve or armored EcN after lyophilization in the timescale of 1800 min. d Schematic of the enteric capsule filled with bacteria used for the experiments with simulated gastric and intestinal fluids. e CFU of naïve or armored EcN after encapsulation in enteric capsules and treatment with simulated gastric and intestinal fluids in the presence or absence of levofloxacin. Statistical comparisons were performed using two-tailed unpaired t-tests (n = 3). For the groups without levofloxacin, p = 0.448823 > 0.05, (n = 3). For the groups with levofloxacin, p = 0.000669 < 0.001. f Growth curve of naïve or armored EcN after recovery from the simulated intestinal fluid containing levofloxacin in the timescale of 1800 min. ns p-value > 0.05, *p-value < 0.05; **p-value < 0.01; ***p-value < 0.001. The graphs of panels b and e represent mean values ± standard error of mean. Significant differences between mean values were evaluated using ANOVA with multiple comparisons.

