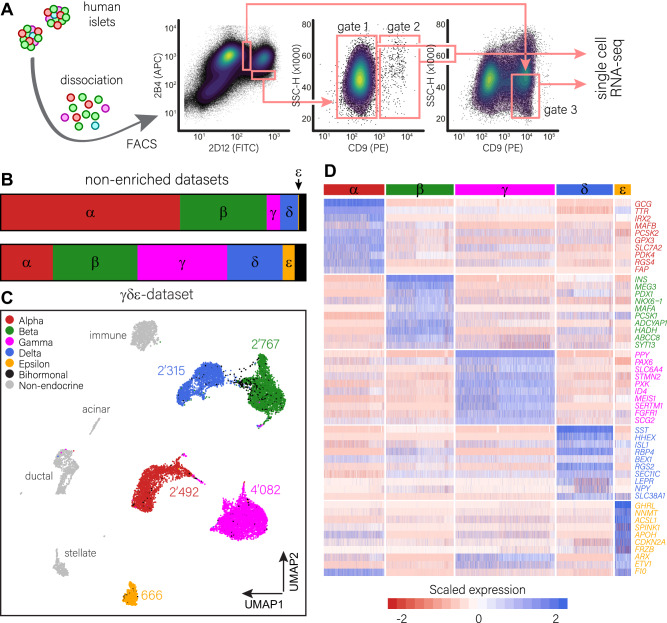
Fig. 2. Generation and validation of a single-cell transcriptomics dataset enriched for γ-, δ- and ε-cells.
A Strategy for the enrichment of human γ-, δ- and ε-cells. Dissociated human islets were labelled with cell-surface antibodies and the different fractions were processed and collected as described. Cells from gate 2 were complemented with cells from gate 1 to 15,000 cells (γ/ε fraction). The δ-fraction of 15,000 cells was collected in gate 3. B Compared to the unsupervised islet cell collection used to produce non-enriched datasets, our dataset contains smaller fractions of α- and β-cells but larger fractions of γ-, δ- and ε-cells. C UMAP dimensional reduction representation of the final dataset. Cells are colour-coded based on their identity. Populations of α-, β-, γ- and δ- cells each contain thousands of cells, while the ε-cell fraction contains hundreds of cells. D Heatmap showing a representative selection of manually selected identity markers for each of the cell types. Low expression levels are marked in red, high expression in blue. The colour bar above indicates the specific populations: α-cells (red), β-cells (green), γ-cells (magenta), δ-cells (blue) and ε-cells (orange). Source data are provided in the supplemental tables and as a source data file.

