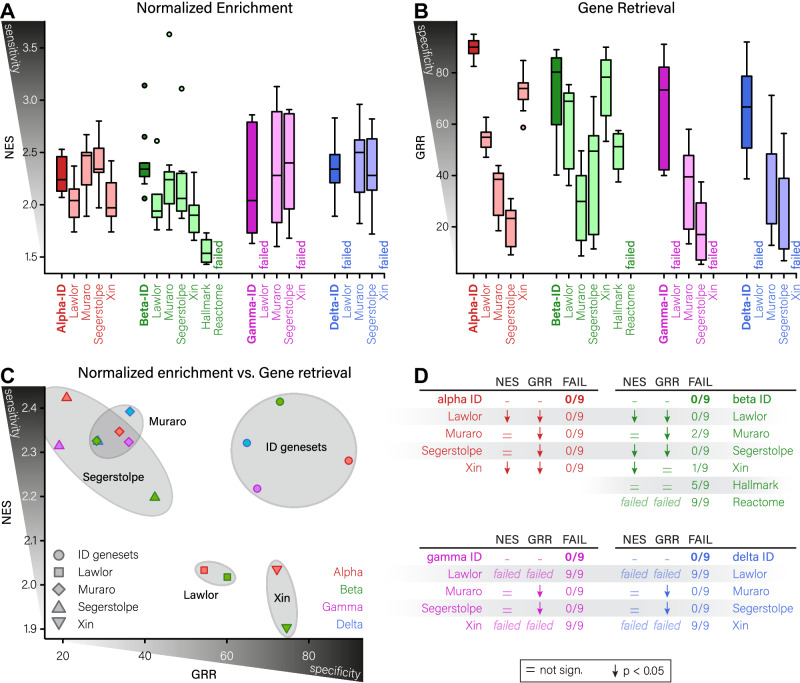
Fig. 4. Evaluation of identity genesets reveals superior on- and off-target scoring compared to previously published ID lists.
A, B Box plots of normalized enrichment (sensitivity; A) and Gene Retrieval Rate (specificity; B) for our islet cell type-specific ID genesets compared to previously published ID lists, using three independent datasets for evaluation (n = 9 per condition). Box plots are colour-coded per cell type (α-, β-, γ- and δ-cells in red, green, magenta and blue, respectively), and distribution follows standard boxplot formatting as min-Q1-median-Q3-max, with individual dots marking outliers. Darker colours indicate our ID genesets. C Scatterplot indicating the relation between NES/sensitivity and GRR/specificity for the different ID genesets. Larger genesets from the Muraro and Segerstolpe datasets score well on sensitivity at the expense of GRR/specificity. The smaller genesets from the Lawlor and Xin datasets are more specific, at the expense of sensitivity. In our ID genesets, we have managed to optimize the trade-off between sensitivity and specificity. Dots are colour coded per cell type (α-cells in red, β-cells in green, γ-cells in magenta, δ-cells in blue) and shaped per dataset. D statistics for on-target, off-target and evaluation metric scoring. Comparisons were made using Wilcoxon signed-rank test; = indicates no significant difference compared to our ID genesets, ↓ indicates a significantly lower score compared to our ID genesets, ‘failed’ indicates all analyses for this geneset failed. NES normalized enrichment score, GRR gene retrieval rate, FAIL number of geneset analyses that did not produce output. Source data are provided as a source data file.

