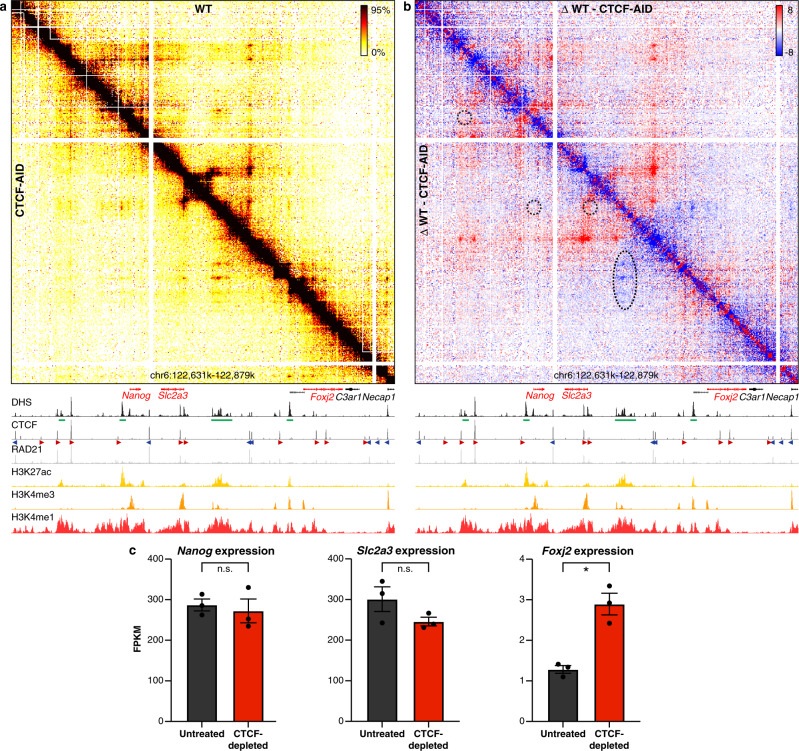
Fig. 4. CTCF depletion results in ectopic enhancer–promoter interactions in the Nanog locus.
a Tiled-MCC contact matrices of the Nanog locus in wild-type mES cells (top-right) and auxin-treated CTCF-AID mES cells (bottom-left) at 500 bp resolution. b Differential contact matrix of the Nanog locus in which interactions enriched in WT mES cells are indicated in red and interactions enriched in auxin-treated CTCF-AID mES cells are indicated in blue. a–b Gene annotation (genes of interest in red, coding genes in black, non-coding genes in gray), DNase hypersensitive sites (DHS), and ChIP-seq data for CTCF, Cohesin (RAD21), H3K27ac, H3K4me3, and H3K4me1 are shown below the matrices. The axes of the DHS and ChIP-seq profiles are scaled to signal and have the following ranges: DHS = 0–10.25; CTCF = 0–3092; RAD21 = 0–3414; H3K27ac = 0–58; H3K4me3 = 0–90; H3K4me1 = 0–2064. Enhancers of interest are indicated in green below the DHS profiles. The orientations of CTCF motifs at prominent CTCF-binding sites are indicated by arrowheads (forward orientation in red; reverse orientation in blue). The dashed circles and oval in b highlight the following interactions of interest (from left to right): Nanog promoter and far upstream enhancer; Nanog promoter and downstream super-enhancer; Slc2a3 promoter and downstream super-enhancer; Foxj2 proximal cis-regulatory elements and upstream super-enhancer. The interactions between the Nanog and Slc2a3 promoters with the enhancers in the region appear unchanged upon CTCF depletion (despite the loss of CTCF-mediated interactions directly upstream of the Slc2a3 promoter), whereas the interactions between the proximal cis-regulatory elements of Foxj2 and the super-enhancer are increased. c Expression of Nanog, Slc2a3, and Foxj2 in untreated (left) and auxin-treated (right) CTCF-AID mES cells, derived from RNA-seq data, normalized for fragments per kilobase of the transcript, per million mapped reads (FPKM). The bars represent the average of n = 3 replicates and the error bars indicate the standard error of the mean. Significant (*) and non-significant (n.s.) changes in expression are indicated. Nanog: P = 0.7030; Slc2a3: P = 0.1774; Foxj2: P = 0.0001 (calculated using Cuffdiff analysis and adjusted for multiple comparisons, as previously decribed27). Source data are provided as a Source Data file.

