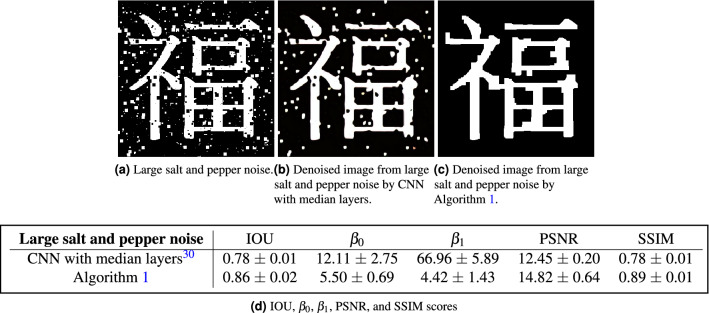
Figure 9.
First row: (a) An example of image with larger spatial scale salt and pepper noise. (b) Corresponding denoised images produced by CNN with Median Layers. (c) Corresponding denoised images produced by Algorithm 1. Second row: The table of evaluation scores IOU, , , PSNR, and SSIM of CNN with median layers and Algorithm 1. For each noise type, 100 images were formed and tested. All scores are recorded by mean ± standard deviation for the 100 trials. The ground truth of the pair is (6, 5).

