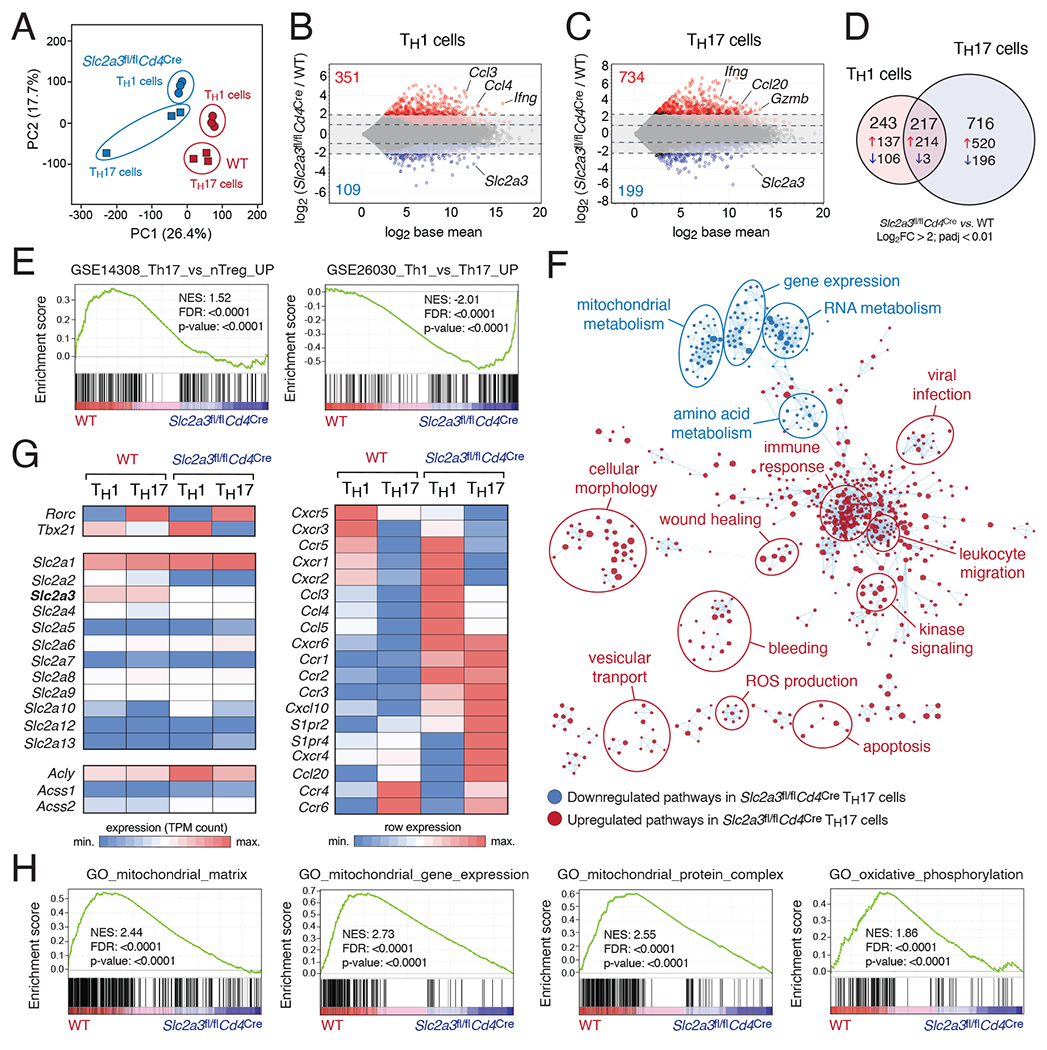
Figure 3. GLUT3 controls a complex metabolic-transcriptional network in Th17 cells.

(A) Principal component (PC) analysis of WT and GLUT3-deficient (Slc2a3fl/flCd4Cre) Th1 and Th17 cell RNA-seq data; n=3 biological replicates per T cell subset and genotype. (B and C) MA plots of differentially expressed genes (DEGs) in WT versus GLUT3-deficient Th1 (B) and Th17 cells (C); genes significantly (padj < 0.01) up- and downregulated are depicted in red and blue, respectively. (D) Venn diagram analyses of > 4-fold DEGs (padj < 0.01) of GLUT3-deficient Th1 and Th17 cells. (E) Gene set enrichment analysis (GSEA) of WT versus GLUT3-deficient Th17 cells. (F) Network clustering of significantly (p < 0.005) enriched gene expression signatures to identify dysregulated physiological processes in GLUT3-deficient Th17 cells. Down- and upregulated gene sets in GLUT3-deficient Th17 cells compared to WT are shown in blue and red, respectively. (G) Heatmap analysis of selected genes in GLUT3-deficient and WT Th1 and Th17 cells. (H) GSEAs of WT versus GLUT3-deficient Th17 cells highlight impaired mitochondrial gene expression and function.
