
Figure 4. GLUT3 supports mitochondrial acetyl-CoA generation.
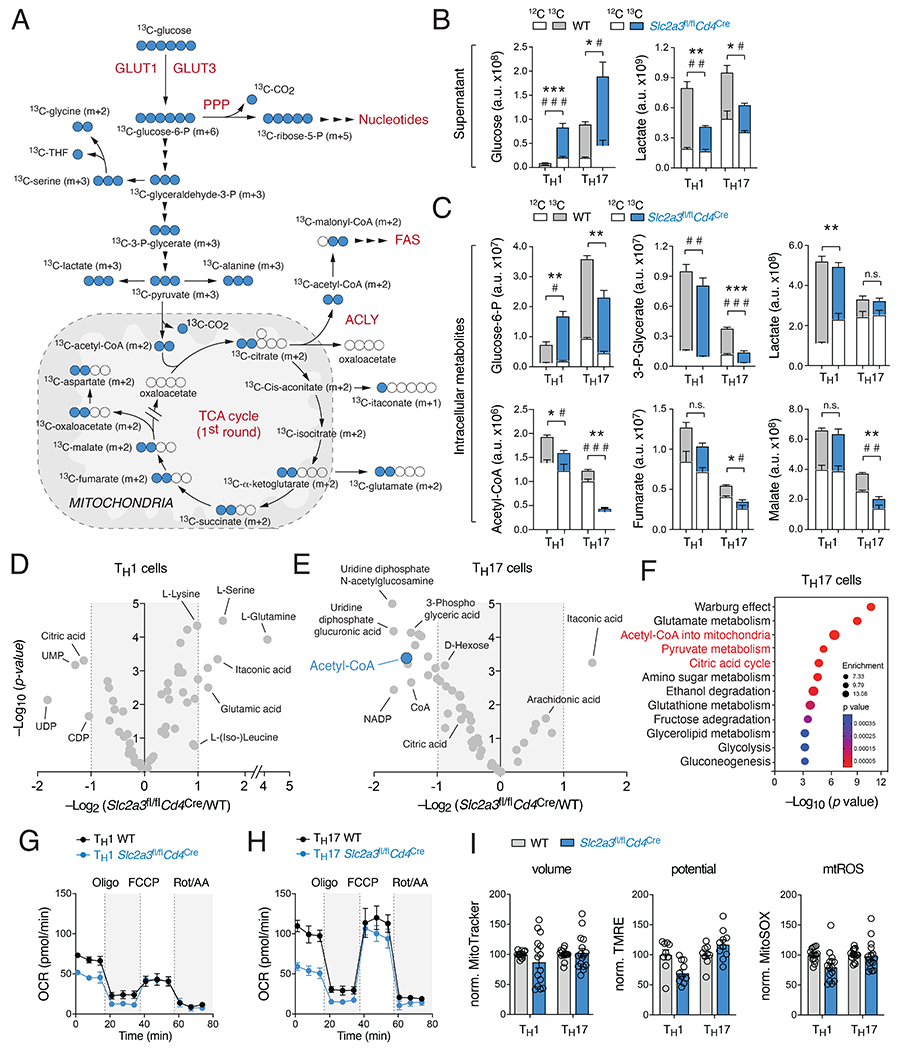
(A) Isotope tracing of glucose-derived metabolites in WT and GLUT3-deficient T cells by liquid chromatography and mass spectrometry (LC/MS). (B) Analysis of 13C-labelled glucose and lactate levels in cell culture supernatants of WT and GLUT3-deficient Th1 and Th17 cells by LC/MS. Asterisks and hash signs indicate significant differences in 13C and 12C-metabolites, respectively. (C) Fractional enrichment of 13C-glucose-derived glycolytic and TCA cycle intracellular metabolites in WT and GLUT3-deficient Th1 and Th17 cells; means ± SEM of 4 biological replicates. (D and E) Volcano plots of differential metabolite concentrations between WT and GLUT3-deficient Th1 (D) and Th17 (E) cells; 4 biological replicates per group. (F) Metabolite set enrichment analysis (MSEA) of differential metabolite concentrations (p < 0.05) between WT and GLUT3-deficient Th17 cells. (G and H) Oxygen consumption rate (OCR) measurements of WT and GLUT3-deficient Th1 (G) and Th17 cells (H) using a Seahorse extracellular flux analyzer; means ± SEM of 5 mice. (I) Analysis of mitochondrial volume (MitoTracker), membrane potential (TMRE) and mitochondrial ROS production (MitoSOX) in WT and GLUT3-deficient T cells; means ± SEM of 10-17 mice. *, p<0.05; ***, p<0.001 by unpaired Student’s t-test (B and C).