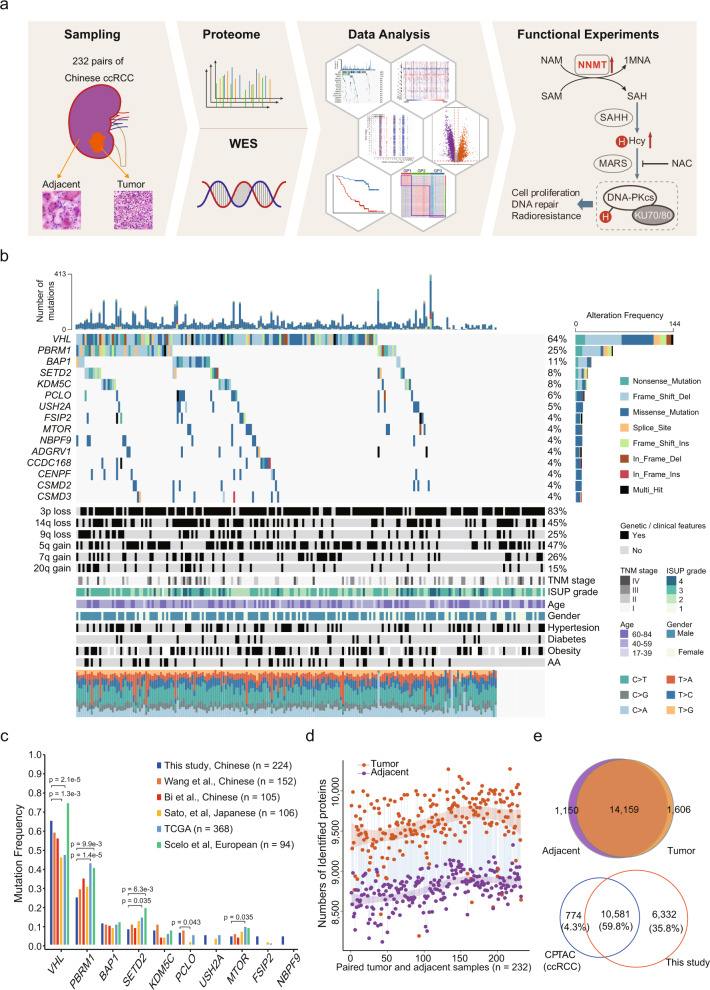
Fig. 1. Proteogenomic Landscape of Chinese ccRCC.
a Schematic representation of the multiomics analyses of ccRCC, including sample preparation, protein identification, WES, and function verification. b Genomic profile and associated clinical features of 224 ccRCC patients. c Comparison of frequently mutated genes among Chinese, Japanese, European, and TCGA cohorts. P values derived from two-sided Fisher’s exact test. d Overview of proteomic profiles of pairwise ccRCC samples. The dashed curves fitted by lasso regression show the distribution of protein identifications. The shading that underlies the lasso curves denotes the 95% confidence intervals. e The upper Venn diagram shows the overlap of proteins identified in tumors and adjacent normal tissues. The lower Venn diagram shows that proteins identified in this study cover most of the proteins identified in the CPTAC ccRCC cohort.

