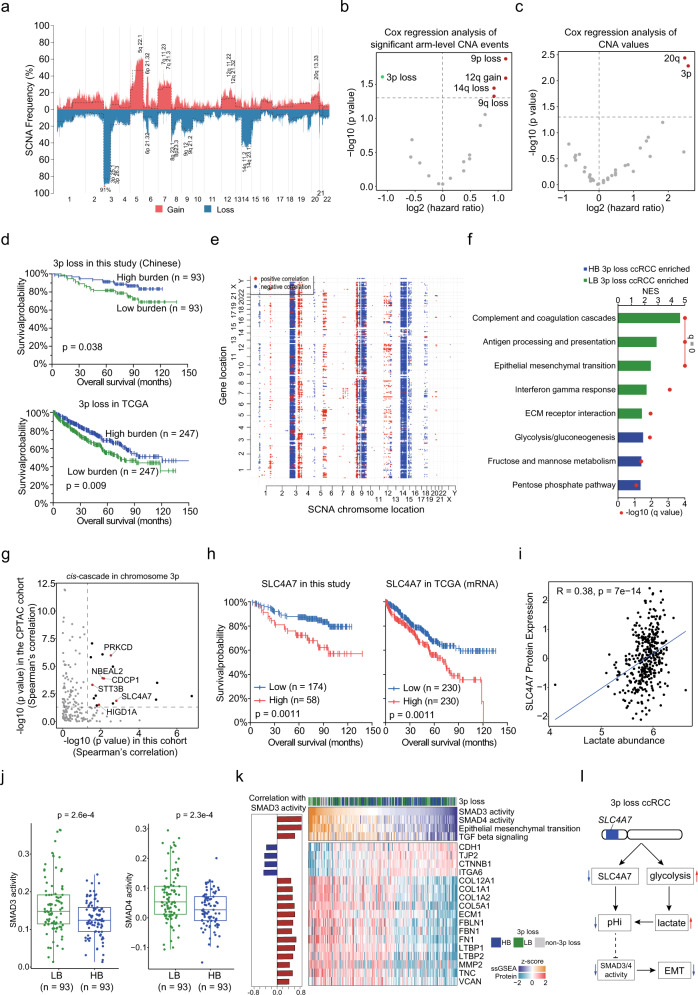
Fig. 2. Profiles of CNAs and Effects of CNA on Somatic Mutations, Proteome, and Overall survival.
a Frequency of SCNAs. Copy number gains and losses are indicated in red and blue, respectively. The dotted line indicates the frequency of arm-level CNA events. b, c Cox regression analysis of significant arm-level CNA events and CN. d Kaplan–Meier curves of OS for patients with different 3p loss burden in the Chinese and TCGA cohorts (two-sided log-rank test). e Correlations of CNA (x axes) with protein abundance (y axes). Significant (q < 0.01) positive (red) and negative (blue) correlations are shown. f GSEA of patients with LB 3p loss (n = 93) compared to patients with HB 3p loss (n = 93). NES, normalized enrichment score. g Prioritizing genes in chromosome 3p. Chromosome 3p gene encoded proteins, with prognostic values (HR > 1, p < 0.05), were annotated by red. h Kaplan–Meier curves of PFS for patients with different SLC4A7 abundances in the Chinese and TCGA cohorts (two-sided log-rank test). i The correlation between SLC4A7 protein expression and lactate abundance (two-sided Spearman’s correlation test) (n = 370). j Comparison of SMAD3 and SMAD4 activities between LB 3p loss group (n = 93) and HB 3p loss group (n = 93). P values are derived from two-sided t test. Boxplots show the median (central line), the 25–75% interquartile range (IQR) (box limits), the ±1.5×IQR (whiskers). k Pathways and proteins, involved in EMT, significantly associated with SMAD3 or SMAD4 activities. The left panel shows Spearman’s correlation between SMAD3 activities and pathway scores/protein abundances. l Proposed model of the pH imbalance induced EMT impairment in 3p loss ccRCC.

