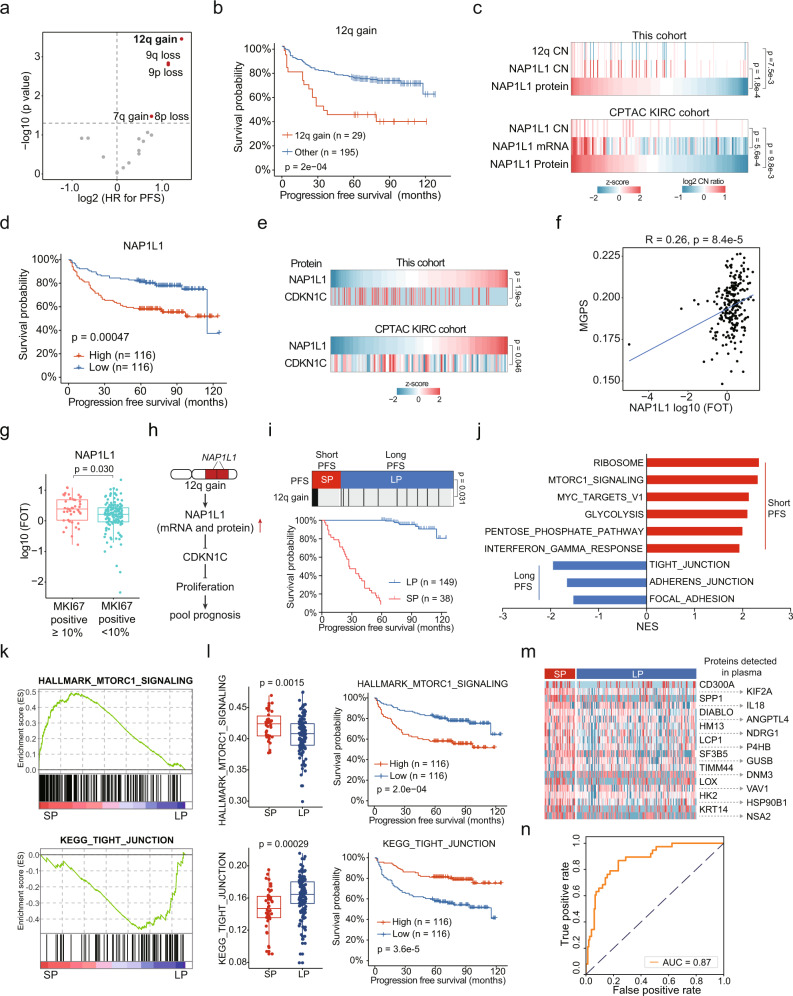
Fig. 3. Proteomic Alterations in ccRCC Compared to Adjacent Tissues.
a Cox regression analysis of significant arm-level CNA events for PFS. b Kaplan–Meier curves of PFS for patients with or without 12q gain (two-sided log-rank test). c Cis-effect of 12q gain on NAP1L1 in this study and CPTAC cohort. P values are derived from two-sided Spearman’s correlation test. d Kaplan–Meier curves of PFS for patients with different NAP1L1 abundances (two-sided log-rank test). e Negative correlations between NAP1L1 and CDKN1C abundances in this study and CPTAC cohort. P values are derived from two-sided Spearman’s correlation test. f Positive correlations between NAP1L1 abundances and MGPS scores in this study (two-sided Spearman’s correlation test). g Comparison of NAP1L1 abundances between tumors with different MKI67 IHC results (MKI67 positive ≥ 10%, n = 44; MKI67 positive < 10%, n = 139). P value is derived from two-sided t test. Boxplots show the median (central line), the 25–75% IQR (box limits), the ±1.5×IQR (whiskers). h Proposed model explaining the 12q gain-induced disease progression in ccRCC. i Up, 12q gains were enriched in SP group compared with LP group. P value is derived from two-sided Fisher’s exact test. Down, Kaplan–Meier curves of PFS for SP group and LP group (two-sided log-rank test). j GSEA of SP group patients compared with LP group patients. NES, normalized enrichment score. k Enrichment plots of MTORC1 signaling in the SP group and tight junction in the LP group. l Comparison of MTORC1 signaling and tight junction scores between the SP (n = 38) and LP (n = 149) groups and the associations of MTORC1 signaling and tight junction scores with PFS. P values are derived from two-sided t test. Boxplots show the median (central line), the 25–75% IQR (box limits), the ±1.5×IQR (whiskers). m Heatmap of plasma proteins significantly upregulated in SP group than LP group. Higher expressions of these proteins were associated with shorter PFS. n The area under the receiver operating characteristic (AUROC) of the 20 plasma proteins predictor.

