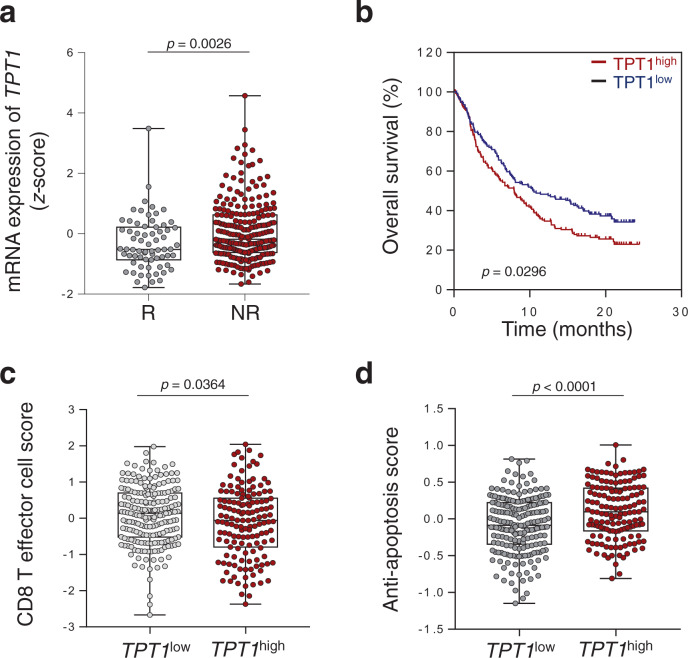
Fig. 1. Increased expression of TPT1 is associated with immune-refractory non-responder phenotype to anti-PD-L1 therapy.
a Comparison of TPT1 expression in responders (R, n = 68) and non-responders (NR, n = 230). b Kaplan–Meier analysis of overall survival (calculated as months to death or months to last follow-up) and median expression cutoff values for the expression level of TPT1 (TPT1high > average; TPT1low < average). The p value was determined by Gehan–Breslow–Wilcoxon test. c CD8+ T cell signature score in TPT1low (n = 201) and TPT1high (n = 148) patients. d Anti-apoptosis signature scores in TPT1low and TPT1high patients. In the dot plots, the center lines indicate the medians; and the ends of the whiskers indicate the maximum and minimum values, respectively. The p values by two-tailed t test a, c and d are indicated. The top and bottom edges of boxes indicate the first and third quartiles, respectively. Data represent the mean ± SD. Source data are provided as a Source Data file.

