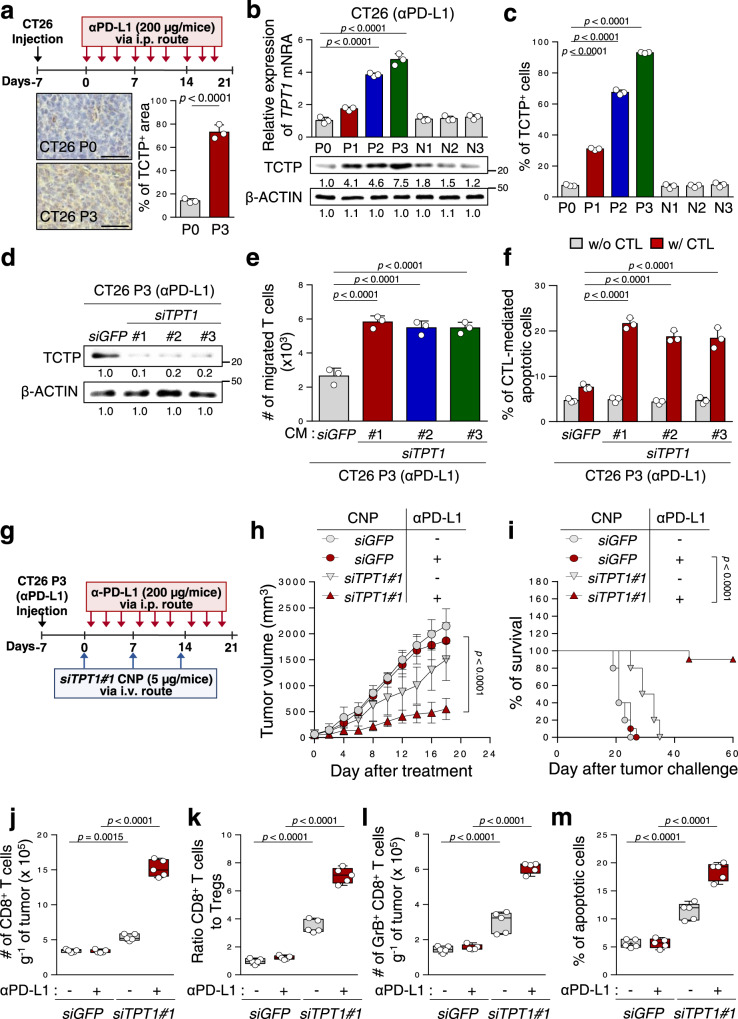
Fig. 2. Silencing TCTP reverses tumor-intrinsic resistance to CTL-mediated killing and the non-T cell-inflamed tumor microenvironment of immune-refractory cancer.
a Schematic of the therapy regimen in BALB/c mice implanted with CT26 P0 or P3 cells (upper). For IHC (lower), 3 mice from each group were used, and randomly selected 3 sections of each CT26 P0 or P3 tumors were analyzed. Scale bar, 50 μm. b TPT1 mRNA and protein levels in CT26 cells at various stages of immune-resistance were determined by qRT-PCR and Western blot (the numbers of each blot are densitometric values). c The percentage of TCTP+ cells were analyzed by flow cytometry. d–e P3 cells were transfected with the indicated siRNAs. d TCTP protein were determined by Western blot analysis. e Transwell-based T cell chemotaxis assay by using siGFP- or siTPT1#1, 2, 3-treated CT26 P3 cell-derived conditioned media (CM). f CFSE-labeled tumor cells were exposed to tumor-specific CTLs and the CFSE+ apoptotic tumor cells was determined by flow cytometric analysis of active-caspase-3. g Schematic of the therapy regimen in BALB/c mice implanted with CT26 P3 cells. h–m CT26 P3 tumor-bearing mice administered siGFP-or siTPT1-CNPs with or without PD-L1 antibody. h Tumor growth and i survival of mice with the indicated reagents. j Flow cytometry profiles of tumor-infiltrating CD8+ T cells. k Tumor-infiltrating CD8+ T cell to CD4+, Foxp3+ Treg cell ratio. l The absolute number of granzyme B+ cells in CD8+ T cells. m The frequency of apoptotic cells in the tumors. For the in vivo experiments, 10 mice from each group were used, and randomly selected 5 samples were analyzed j–m. All in vitro experiments were performed in triplicate. The p values by two-way ANOVA f, h, one-way ANOVA b, c, e and j–m, and the log-rank (Mantel–Cox) test i are indicated. In the box plots, the top and bottom edges indicate the first and third quartiles; the center lines indicate the medians; and the whiskers ends indicate the maximum and minimum, respectively. The data represent the mean ± SD. Source data are provided as a Source data file.

