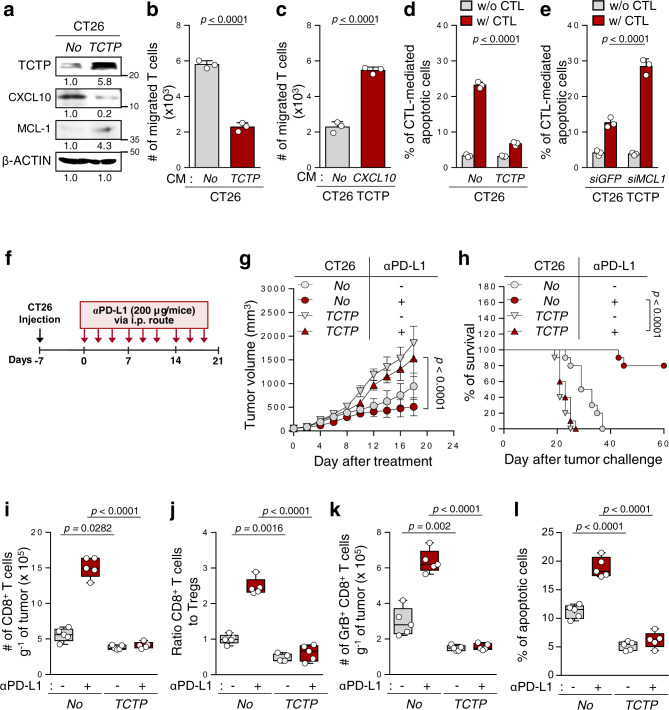
Fig. 3. Overexpression of TCTP changes the properties of tumor cells to those of an immune-refractory tumor.
a, b and d CT26 cells were stably transfected with empty vector (No) or TCTP. a The levels of TCTP, CXCL10, and MCL-1 were analyzed by Western blots. b T cell chemotaxis assays were performed using CT26 No or CT26 TCTP cell-derived CM. c The migrated T cells were counted after incubation with empty vector- or CXCL10-transfected CT26 TCTP cell-derived CM. d and e CFSE-labeled tumor cells were incubated with tumor-specific CTLs and the frequency of CFSE+ apoptotic tumor cells was determined by flow cytometric analysis of active-caspase-3. f Schematic of the therapy regimen in BALB/c mice implanted with CT26 No or CT26 TCTP cells. g–l Tumor-bearing mice administered treatment or not treated with the PD-L1 antibody. g Tumor growth and h survival of mice inoculated with CT26 No or TCTP cells treated with or without PD-L1 antibody. i Flow cytometry profiles of tumor-infiltrating CD8+ T cells. j Tumor-infiltrating CD8+ T cell to CD4+, Foxp3+ Treg cells ratio. k The absolute number of granzyme B+ to tumor-infiltrating CD8+ T cells. l The frequency of apoptotic cells in the tumors treated with the indicated reagents. All in vitro experiments were performed in triplicate For the in vivo experiments, 10 mice from each group were used, and randomly selected 5 samples were analyzed i–l. The numbers below the blot images indicate the expression as measured fold change a. The p values by by two-tailed t test b, c, one-way ANOVA i–l, two-way ANOVA d, e, g, and the log-rank (Mantel–Cox) test h are indicated. In the box plots, the top and bottom edges of boxes indicate the first and third quartiles, respectively; the center lines indicate the medians; and the ends of whiskers indicate the maximum and minimum values, respectively. The data represent the mean ± SD. Source data are provided as a Source data file.

