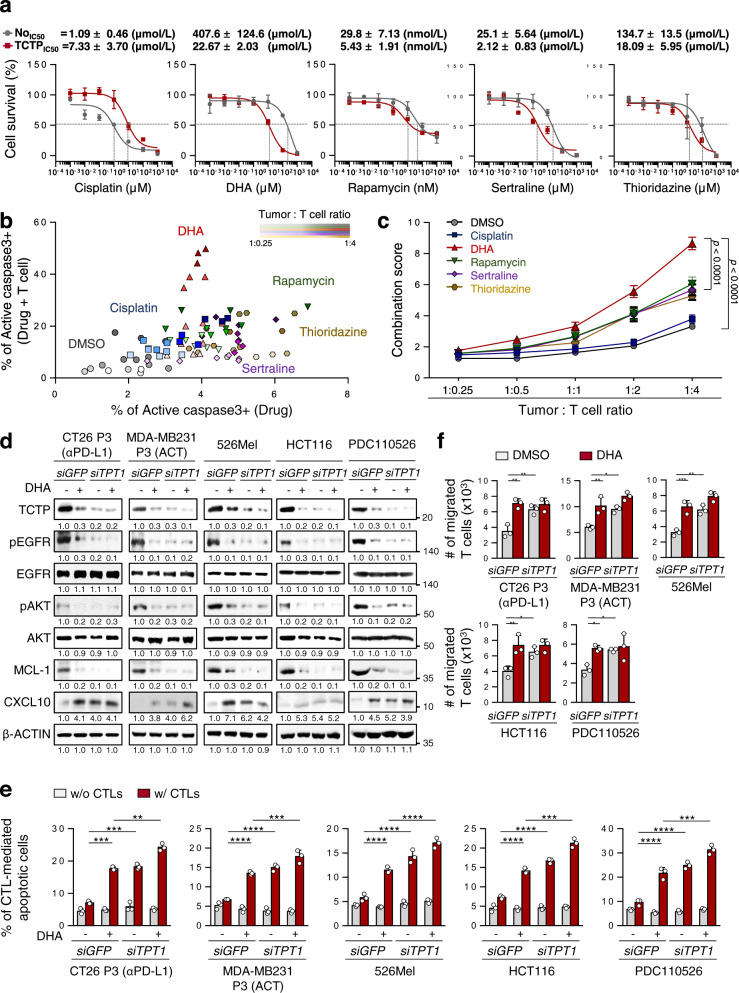
Fig. 6. Inhibition of TCTP by DHA sensitizes TCTPhigh tumor cells to T cell-mediated killing and increases T cell migration.
a CT26 No and TCTP cells were treated with the indicated concentrations of cisplatin, DHA, rapamycin, sertraline, and thioridazine for 24 h. Cell viability was measured by the trypan blue exclusion assay, and then the concentrations causing a 50% decrease in cell viability (IC50 values) were determined. b CT26 TCTP cells were treated with the indicated agents, and incubated with tumor-specific CTLs at the indicated tumor: T cell ratio. The percentage of active-caspase-3+ apoptotic tumor cells was analyzed by flow cytometry. c The combination score was calculated based on changes in the percentage of apoptosis in drug-treated tumor cells with or without CTLs. Combination score = (% of active-caspase 3+ tumor cells by drug and CTLs) / (% of active-caspase 3+ tumor cells by drug). d SiGFP- or siTPT1-treated CT26 P3, MDA-MB231, 526Mel, HCT116, and PDC110526 cells were treated with DMSO or DHA. The levels of TCTP, pEGFR, EGFR, pAKT, AKT, MCL-1, CXCL10, and β‐ACTIN were analyzed by western blots. e The percentage of CTL-mediated anti-apoptotic tumor cells was determined by flow cytometry. f T cell chemotaxis assays were performed using DMSO or DHA-treated siGFP- or siTPT1-treated tumor cell CM. The data are representative of three separate experiments. The numbers below the blot images indicate the expression as measured as fold change d The error bars represent mean ± SD. *p < 0.05,**p < 0.01, ***p < 0.001, and ****p < 0.0001. The p values by two-way ANOVA c, e, f are indicated. Source data and exact p values are provided as a Source data file.

