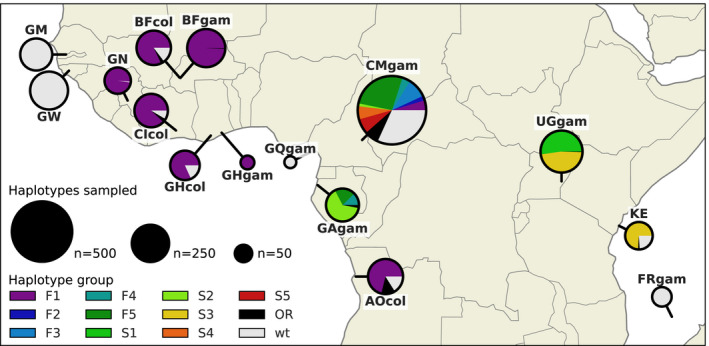
FIGURE 4.

Map of haplotype frequencies. Each pie shows the frequency of different haplotype groups within one of the populations sampled. The size of the pie is proportional to the number of haplotypes sampled. The size of each wedge within the pie is proportional to the frequency of a haplotype group within the population. Haplotypes in groups F1‐F5 carry the L995F kdr allele. Haplotypes in groups S1–S5 carry the L995S kdr allele. Haplotypes in group other resistant (OR) carry either L995F or L995S but did not cluster within any of the haplotype groups. Wild‐type (wt) haplotypes do not carry any known resistance alleles
