
FIGURE 2.
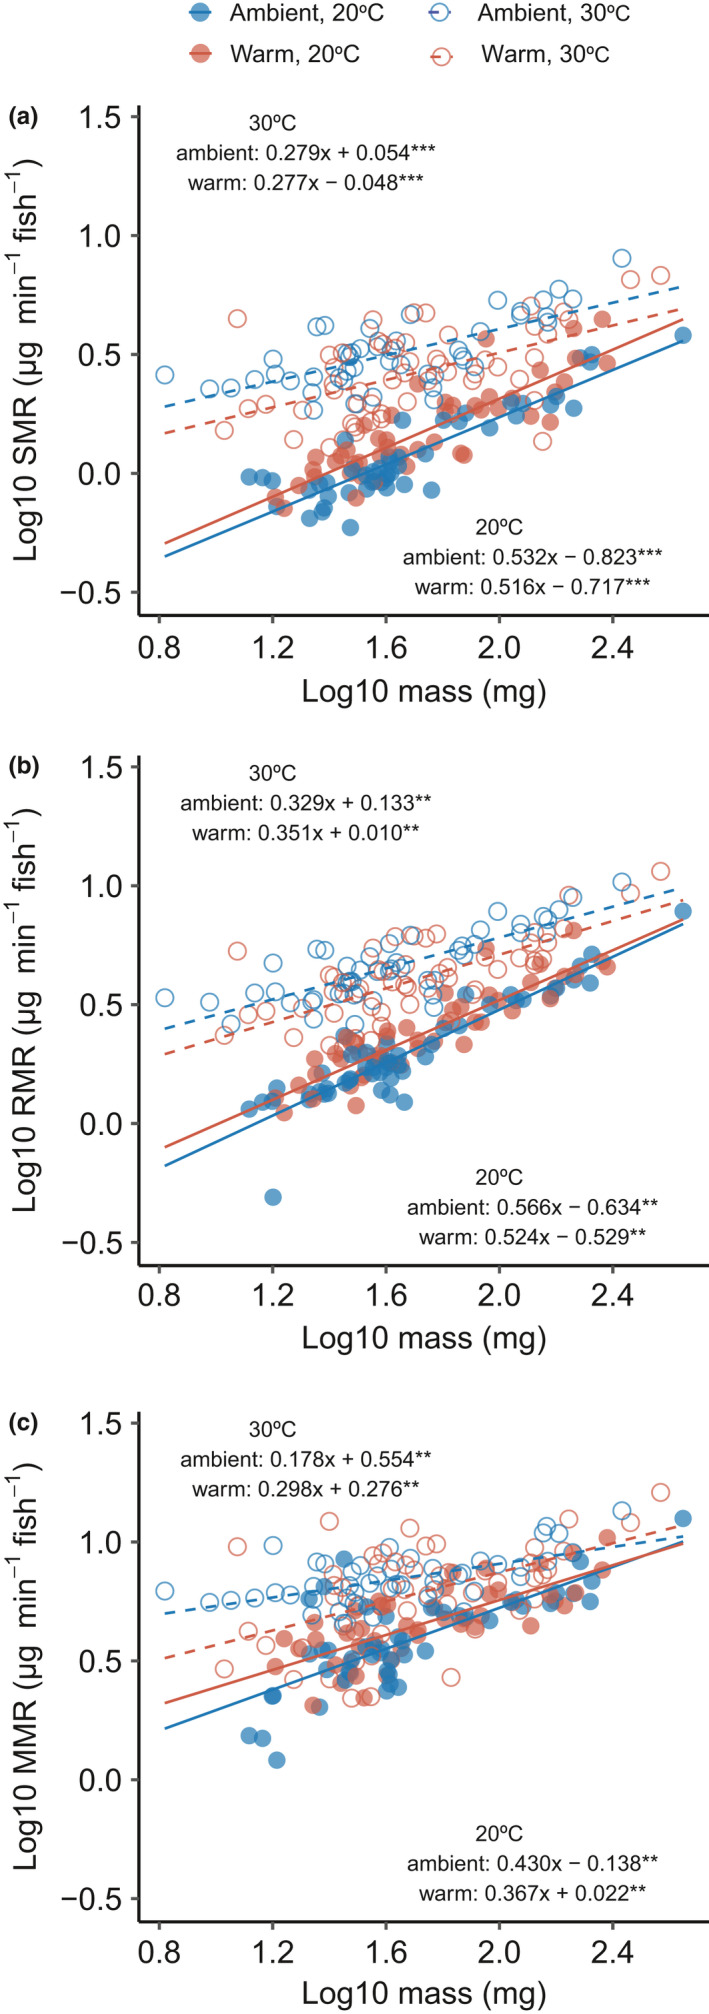
Relationship between fish mass and (a) standard metabolic rate (SMR), (b) routine metabolic rate (RMR), and (c) maximum metabolic rate (MMR) in Gambusia affinis. Dashed lines and open circles represent acclimation at 20°C, and solid lines and filled circles represent acclimation at 30°C. Warm and ambient refer to the population's thermal history (see Table 1). We fit data with simple linear regression models and denoted significance of these models as: <0.0001 ‘***’, <0.001 ‘**’, n = 198/ trait