FIGURE 4.

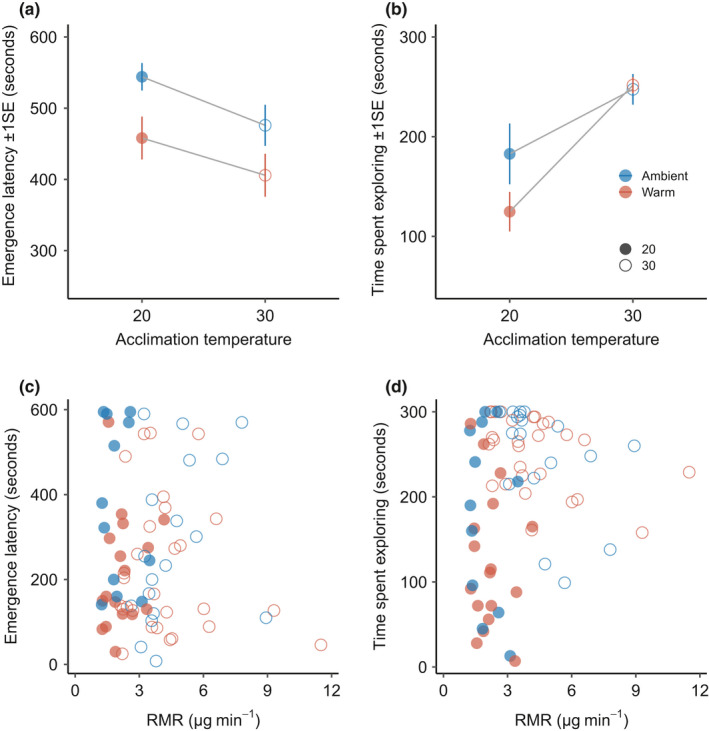
Relationship between thermal history and behavior as (a) boldness (i.e., emergence latency) and (b) activity (i.e., time spent exploring) as population differences. Plots (c) and (d) show the relationship between routine metabolic rate (RMR) and behavior as boldness and activity, respectively. We do not show individuals who did not leave the refuge, n = 76
