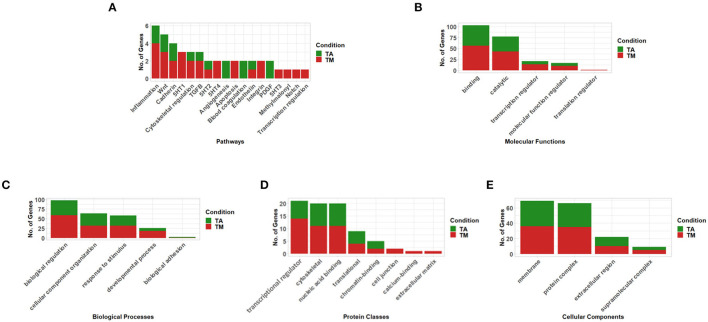
Figure 3.
Functional classification of genes associated with differentially methylated promoters (q-value < 0.05 & meth.diff >|10|) between aortic and mitral tissue according to (A) Pathways, (B) Molecular Functions, (C) Biological Processes, (D) Protein Classes and (E) Cellular Components (selected results, the remaining can be found in Supplementary Figure 5– analysis performed using PANTHER). In the stacked bar graphs, TA (green) labels genes with promoters that show increased methylation in the aortic compared to the mitral valves and TM (red) shows genes whose promoters exhibit increased methylation in the mitral compared to the aortic valves.

